Mexico earthquake seen from space: Sentinel-1 radar images show how Mexico quake deformed the earth
Differential SAR interferometry (DInSAR) is a technique that allows to detect and measure deformations of the earth’s crust through the analysis of interferogram. Interferograms are generated from two images collected by radar transported on board of artificial satellites. Unlike other kind of sensor used in the remote sensing applications (e.g. optical cameras), radars allow to record the phase of the electromagnetic wave backscattered from the earth’s surface. Through the measurement of this phase, it is possible to reconstruct the target-sensor distance. The phase variations between successive acquisition, caused by mutations on the Earth’s surface, are recorded in the interferograms and represented by a series of fringes. These allow us to locate and quantify the deformation occured. DInSAR technique has been successfully applied to detect the effects on the earth’s surface due to subsidence, landslides, bradyseism, volcanic inflation-deflation cycles and telluric effects. Using two radar images collected by satellites Sentinel-1A/B of the European Space Agency we were able to quantify the deformations induced by the 7.1 magnitude earthquake that stroke Mexico on 19 September 2017.
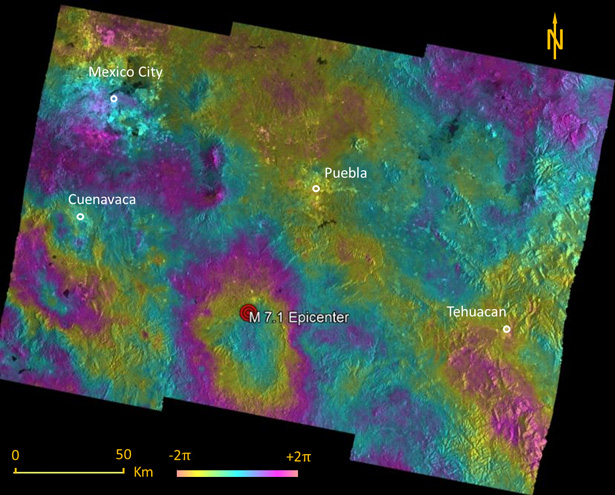
The interferogram, generated from Sentinel-1A image collected the 17 of September, 2 days before the earthquake, and the acquisition the twin mission Sentinel-1B, post-event, 6 days later, shows clear concentric fringes in the area surrounding the epicenter (Figure 1).
(Figure 1: Interferometric fringes caused by the M 7.1 earthquake that stroke Mexico on 19 September 2017)
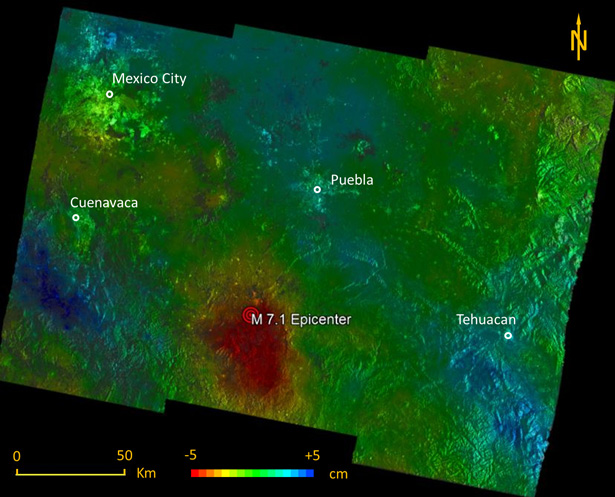
The phase information was converted in terms of displacement in Figure 2, which reproduces the earthquake effect on the earth surface. The first estimates indicate a crust subsidence (in red) of about 5 cm over an area of more than 1,000 square kilometers. At the margin of this region, two uplifting area (in blue) can be recognized, the most evident located south of the Cuernavaca city, west of the epicenter.
(Figure 2: Displacement map elaborated from the interferogram. Red areas represent the regions where the crust lowered, while the blue ones indicate a surface uplift. Green areas have not undergone variations.)
The work was carried out by Matteo Mantovani, IRPI CNR researcher at the Padua office.