Palma B., Calcaterra D. & Parise M., 2009, Modelli geologici e meccanismi di innesco di frane da scorrimento-colata rapida nei depositi vulcanoclastici della Campania,
126 (2009): 21–48.,
Sorriso-Valvo M., Greco R., and Catalano E., 2009, Spatial prediction of regional-scale mass movement using Logistic Regression analysis and GIS.,
57-08 (2009): 263–280.,
Abstract
The spatial prediction of mass-movement phenomena (y) can be achieved by assessing the probability (Py) ...
The spatial prediction of mass-movement phenomena (y) can be achieved by assessing the probability (Py) that in any given point of the area under study, such a phenomenon exists (y = 1) or not (y = 0). The problem can be faced using a multivariate statistical procedure named Logistic Regression (LR), by means of which the probability that the value of a dichotomous variable (event exists/does not exists) is 1 (= event exists).
The LR procedure is robust_ the independent variables can either be categorical or parametric and no fitting of their frequency distribution with normal distribution is required. The procedure is based on the fitting of a probabilistic regression model on a sample made of affected and non affected sites, and then applying the optimised model in the remaining study area. For best results, affected and non affected sampling sites should be of comparable extent.
The procedure has been performed in the whole Calabria Region, South Italy, ca. 15,000 km2. Transforming the categorical independent variables into ordinal variables based on observed landslide frequency for each class, allowed improving the performance of RL. Validating the performance by means of a regression of expected values on observed values for different types of mass-movement yields R values in the range 0.97 - 1.00, and the regression line slope ranging from 0.95 to 1.33, if the threshold for existent event (y = 1), based on prevalence criterion, is set at Py > 0.5. ROC curve show a negative flex when the threshold is close to 0.75, in correspondence of which ca. 80% of true unstable and ca. 75 of true stable cells are correctly predicted. Thus, P(y) = 75% can be adopted a threshold value for maximum probability class for mass-movement presence.
Lamanna C., Casarano D., Wasowski J., 2009, Cambiamenti delluso del suolo e aumento dellattività franosa nel territorio di Rocchetta SantAntonio (Appennino dauno),
22(2) (2009): 139–156.,
1 Tecca, P.R.,2 Genevois, R., 2009, Field observations of the June 30, 2001 debris flow at Acquabona (Dolomites, Italy).,
Landslides (Berl., Print) 61 (2009): 39–45. doi_10.1007/s10346-009-0145-8,
DOI: 10.1007%2Fs10346-009-0145-8
Terranova O. ; Antronico L. ; Coscarelli R. ; Iaquinta P., 2009, Soil erosion risk scenarios in the Mediterranean environment using RUSLE and GIS_ An application model for Calabria (southern Italy),
Geomorphology (Amst.) 112 (2009): 228–245. doi_10.1016/j.geomorph.2009.06.009,
DOI: 10.1016%2Fj.geomorph.2009.06.009
Abstract
Soil erosion by water (WSE) has become a relevant issue at the Mediterranean level. In ...
Soil erosion by water (WSE) has become a relevant issue at the Mediterranean level. In particular, natural
conditions and human impact have made the Calabria (southern Italy) particularly prone to intense WSE. The
purpose of this investigation is to identify areas highly affected by WSE in Calabria by comparing the
scenarios obtained by assuming control and preventive measures and actions, as well as actual conditions
generated by forest fires, also in the presence of conditions of maximum rainfall erosion.
Geographic Information System techniques have been adopted to treat data of reasonable spatial resolution
obtained at a regional scale for application to the RUSLE model. This work is based on the comparison of such
data with a basic scenario that has been defined by the present situation (present scenario). In this scenario_
(i) R has been assessed by means of an experimental relation adjusted to Calabria on the basis of 5-min
observations; (ii) K has been drawn from the soil map of Calabria including 160 soilscapes; (iii) LS has been
estimated according to the RUSLE2 model by using (among other subfactors) a 40-m square cell DTM; (iv) C
has been derived by processing the data inferred from the project Corine Land Cover, whose legend includes
35 different land uses on three levels; and (v) P has been hypothesized as equal to 1.
For the remaining three hypothesized scenarios, the RUSLE factors have been adjusted according to
experimental data and to data in the literature. In particular, forest areas subject to fire have been randomly
generated as far as fire location, extension, structure, and intensity are concerned.
The values obtained by the application of the RUSLE model have emphasized that land management by
means of measures and actions for reducing WSE causes a notable reduction of the erosive rate decreasing
from ~30 to 12.3 Mg ha-1 y-1. On the other hand, variations induced by hypothetical wildfires in forests on
10% of the regional territory bring WSE over the whole region to values varying from 30 to 116Mg ha-1 y-1.
This study can be offered to territorial planning authorities as an evaluation instrument as it highlights the
merits and limitations of some territorial management actions. In fact, in Calabria no observations exist
concerning the implications of these actions.
Mortara G., 2009, Report of the glaciological survey of 2008,
32(2) (2009): 277–297.,
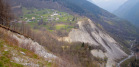
Turconi L., Kuman De S., Tropeano D., Savio D., 2009, Slope failure and related processes in the Mt. Rocciamelone area (Cenischia Valley, Western Italian Alps),
Geomorphology (Amst.) 114(3 (2009): 115–128.,
Abstract
The present article aims at studying slope failure processes and debris flows in the Mt. ...
The present article aims at studying slope failure processes and debris flows in the Mt. Rocciamelone area in the Cenischia Valley of the Western Italian Alps (Graian Alps). Debris flow events in the study area since 1993 have been investigated through instrumental records, on-site surveys and data analysis related to the triggering causes, debris flow dynamics and rainfall. The first rockfall was witnessed on the western slopes of Mt. Rocciamelone on 26 December 2006, heading from the Marderello catchment above Novalesa Village in the Torino Province. The inception zone was recognized just below the crest line around 3200 m a.s.l., which connects the Cà d'Asti landslide to the highest peak (3538 m a.s.l.). Such events occurred during the winter and from June 2007 to early September when the frequency of major rotational slides and rockfalls increased. The whole process of instability affected at least 4 × 10⁴ m2 of surface area and dismantled about 4 × 10⁵ m3 of weathered rock. Stony debris appears to have been inscribed in a larger deep-seated gravitational slope failure that comprises the whole valley system surrounding Novalesa Village. The catchment characteristics of the study area have been investigated through intensive field surveys since 1991. Meteorological and rainfall data of different elevations have also been collected since 1991 by the monitoring equipment set up in the field to investigate the environmental conditions and meteorological factors responsible for triggering debris flows. Rainfall intensity values for the onset conditions of a given event have been identified. The values appeared surprisingly low compared to usual values reported for soil slip/debris flow events worldwide. A continuous sediment supply from rockfalls has been recorded which is associated with a larger, deep-seated gravitational spreading system.
Audisio C., Nigrelli G., Lollino G., 2009, A GIS tool for historical instability processes data entry_ An approach to hazard management in two Italian Alpine river basins,
Computers & geosciences 35 (2009): 1735–1747. doi_10.1016/j.cageo.2009.01.012,
DOI: 10.1016%2Fj.cageo.2009.01.012
Abstract
Analysis of instability processes requires historical data over a range of temporal and spatial scales. ...
Analysis of instability processes requires historical data over a range of temporal and spatial scales. While historical data offer a wealth of information about when, where and how a flood or a landslide happened or may recur, managing the data remains problematic. Before the data can be entered into historical and geographical databases, they need to be extracted from a vast variety of paper documents and transformed into a standard format. To do this, we developed a Geographical Information System (GIS)-based tool that permits easy data entry for comparing information on different temporal and spatial scales. The GIS tool was combined with a methodology for spatial data analysis to identify main hazardous areas. The historical and geographical databases were then queried with this tool to obtain the frequency of catastrophic events and their spatial recurrence. The GIS tool allowed accurate and rapid data management for establishing a connection between textual and spatial information for new data generation. This paper illustrates a methodology that utilizes the GIS tool for analyzing instability processes in two Italian river basins in the Western Alps.
Nigrelli G., Audisio C., 2009, The May 2008 extreme rain event in the Germanasca Valley (Italian Western Alps): processes and effects observed along the hydrographic network and valley slopes,
32(2) (2009): 157–166.,
Abstract
This article describes an extreme rain event (28-30 May 2008) in the Germanasca Valley. It ...
This article describes an extreme rain event (28-30 May 2008) in the Germanasca Valley. It gives details on rainfall data and on the processes and effects observed along the hydrographic network and valley slopes. The recent event data were compared with those of previous events (1728-2008). The analysis was carried out using a GIS application specifically designed to identify areas of major hazard, for geo-hydrologic risk mitigation and civil protection, as well as to define rainfall threshold values that could be useful for activating local warning systems. The data analysis showed that major risk situations are associated with rock fall, complex landslides and bank erosion and that the basin areas and the type of damage are consistently the same in extreme rainfall events. With
improved identification of hazard and risk scenarios, more effective interventions in an area could be undertaken to mitigate hydraulic and geologic risk.
Guzzetti F.; Reichenbach P.; Ardizzone F.; Cardinali M.; Galli M., 2009, Landslide hazard assessment, vulnerability estimation and risk evaluation_ an example from the Collazzone area (central Umbria, Italy).,
Geografia fisica e dinamica quaternaria (Testo stamp.) 32 (2009): 183–192.,
Abstract
For the Collazzone area, central Umbria, landslide hazard was ascertained, landslide vulnerability was determined, and ...
For the Collazzone area, central Umbria, landslide hazard was ascertained, landslide vulnerability was determined, and landslide risk was evaluated, for different scenarios. To ascertain landslide hazard, a probabilistic model was adopted that predicts where landslides will occur, how frequently they will occur, and how large they will be in a given area. For the purpose, a multi-temporal landslide inventory map prepared through the interpretation of five sets of aerial photographs and field surveys covering the period from 1941 to 2004 was exploited. Using a 10 m × 10 m DEM, the study area was partitioned into 894 slope units, and the probability of spatial landslide occurrence was obtained through discriminant analysis of thematic and environmental variables. For each slope unit, the probability of experiencing one or more landslides in different periods was determined adopting a Poisson probability model for the temporal occurrence of landslides. The probability of landslide size was obtained by analyzing the frequency-area statistics of landslides. Assuming independence, landslide hazard was ascertained as the joint probability of landslide size, of landslide temporal occurrence, and of landslide spatial occurrence. For the Umbria region, landslide vulnerability curves exist. The curves were established exploiting information on landslide damage to buildings and roads caused by individual landslides of the slide type. Assuming independence of hazard and vulnerability, and exploiting (i) the multi-temporal landslide inventory map, (ii) the obtained landslide hazard assessment, and (iii) the available landslide vulnerability curves, landslide risk to the road network was evaluated, for different scenarios. Results indicate that landslide risk can be determined quantitatively over large areas, provided adequate forecasting models are adopted and reliable landslide and thematic information is available.
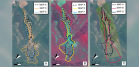
Petrucci O.; Polemio M.; Pasqua A., 2009, Analysis of damaging hydrogeological events_ the case of Calabria region (southern Italy),
Environmental management (N. Y.) 43 (2009): 483–495. doi_10.1007/s00267-008-9234-z,
DOI: 10.1007%2Fs00267-008-9234-z
Abstract
A period of bad weather conditions due to prolonged intense rainfall and strong winds can ...
A period of bad weather conditions due to prolonged intense rainfall and strong winds can trigger landslides, floods, secondary floods (accumulation of rain on surfaces with low permeability), and sea storms, causing damage to humans and infrastructure. As a whole, these periods of bad weather and triggered phenomena can be defined as damaging hydrogeological events (DHEs). We define a methodological approach based on seven simple indexes to analyze such events. The indexes describe the return period (T) and trend of rainfall, the extent of hit areas, and the level of damages; they can be considered attributes of georeferenced features and analyzed with GIS techniques. We tested our method in an Italian region frequently hit by DHEs. In a period of 10 years, 747 damaging phenomena (landslides, 43%; floods, 38%) and 94 DHEs have been classified. The road network and housing areas are the most frequently damaged elements, threatened by all types of damaging phenomena. T classes are almost in accordance with the level of damage. These results can be used to outline warning levels for civil protection purposes, to forecast the areas most likely to be hit and the potential ensuing damage, to disseminate information concerning vulnerable areas, and to increase peoples awareness of risk.
Marchi L.; Borga M.; Preciso E.; Sangati M.; Gaume E.; Bain V.; Delrieu G.; Bonnifait L.; Poganik N., 2009, Comprehensive post-event survey of a flash flood in Western Slovenia_ observation strategy and lessons learned.,
Hydrological processes (Print) 23 (2009): 3761–3770. doi_10.1002/hyp.7542,
DOI: 10.1002%2Fhyp.7542
Abstract
Spatial and temporal scales of occurrence of flash floods, combined with the space
and time scales ...
Spatial and temporal scales of occurrence of flash floods, combined with the space
and time scales of conventional measurement networks of rain and discharge,
make these events particularly difficult to observe. The effective documentation
of flash floods requires post-flood survey strategies encompassing accurate radar
rainfall estimation, field observations of the geomorphic processes associated with
the flood, indirect reconstruction of peak discharges and interviews of eyewitnesses.
This paper describes the methods applied and the results achieved in the survey of
a flash flood that occurred on 18th September 2007 in the Selska Sora watershed
(Western Slovenia). Hydrometeorological analyses of the storm are based on radar
reflectivity observations. The documentation of the flash flood reveals high peak
flood discharges and a complex flood response. Peak discharges were estimated at
22 cross sections, with drainage areas ranging from 0·2 to 147 km2. Among the
lessons learned from the field study of the Selska Sora flash flood, there are three
key conclusions that can inform similar studies. Firstly, geomorphological surveys
are an important prerequisite for flood discharge reconstruction in mountainous
watersheds affected by debris flow and intense sediment transport. Secondly,
the accounts of eyewitnesses of the flood provide a unique contribution to event
reconstruction. Finally, it is necessary to have quality controlled weather radar
data, which may permit coupling field observations with rainfall-runoff modelling.
Cotecchia, V., De Bellis P., Lollino P., Monterisi L., Tria D., 2009, Geostructural survey and stability analysis of the calcareous cliff of Vieste (Southern Italy),
Bulletin of engineering geology and the environment (Print) 68 (2009): 35–45. doi_10.1007/s10064-008-0169-7,
DOI: 10.1007%2Fs10064-008-0169-7
Abstract
Some years ago several large collapses of the fractured calcareous rocks in the Vieste cliff ...
Some years ago several large collapses of the fractured calcareous rocks in the Vieste cliff occurred. Due to both the structural condition of the rock mass and the tectonic alignment of this part of south east Italy, the bedding is variable. Where the cliff is oriented NE (Iudeca street) the bedding planes are almost dipslope with an inclination lower than the slope angle, whereas in the Punta San Francesco they are counterslope. The intersection of the joints results in the formation of prismatic blocks of various sizes, which are frequently in a condition of
incipient fall. A combined geological and structural survey of the cliff was undertaken and distinct element analyses
performed to evaluate the evolution of the stress-strain behaviour of the cliff.
Iovine G. (1) & M.F. Sheridan (2), 2009, Special issue 2006 in Computers and Geosciences on “Modelling and simulation of dangerous phenomena, and innovative techniques for hazard mapping and mitigation”,
Computers & geosciences 35 (2009): 869–870. doi_10.1016/S0098-3004(09)00094-6,
DOI: 10.1016%2FS0098-3004(09)00094-6
Iovine G. (1) & M.F. Sheridan (2), 2009, Special Issue 2007 in Natural Hazards on “Modelling and simulation of dangerous phenomena, and innovative techniques for hazard mapping and mitigation” (Preface),
Natural hazards (Dordr.) 50 (2009): 409–411. doi_10.1007/s11069-009-9420-1,
DOI: 10.1007%2Fs11069-009-9420-1
Parise M. (1) & Iovine G. (2), 2009, Preface to the special issue on “Innovative approaches for evaluating landslide hazard and risk”,
Geografia fisica e dinamica quaternaria (Testo stamp.) 32 (2009): 179–181.,
Lopez N., Spizzico V. & Parise M., 2009, Geomorphological, pedological, and hydrological characteristics of karst lakes at Conversano (Apulia, southern Italy) as a basis for environmental protection,
Environmental geology (Berl.) 58 (2009): 327–337.,
Molerio Leon L. & Parise M., 2009, Managing environmental problems in Cuban karstic aquifers,
Environmental geology (Berl.) 58 (2009): 275–283.,
Parise M., De Waele J. & Gutierrez F., 2009, Current perspectives on the environmental impacts and hazards in karst,
Environmental geology (Berl.) 58 (2009): 235–237.,
North L.A.; Van Beynen P.E.; Parise M., 2009, Interregional comparison of karst disturbance_ West-central Florida and southeast Italy,
Journal of environmental management 90 (2009): 1770–1781. doi_10.1016/j.jenvman.2008.11.018,
DOI: 10.1016%2Fj.jenvman.2008.11.018
Abstract
The karst disturbance index (KDI) consists of 31 environmental indicators contained within the five
broad categories_ ...
The karst disturbance index (KDI) consists of 31 environmental indicators contained within the five
broad categories_ geomorphology, hydrology, atmosphere, biota, and cultural. The purpose of this
research is to apply the KDI to two distinct karst areas, west Florida, USA, and Apulia, Italy. Through its
application, the utility of the index can be validated and other important comparisons can be made, such
as differences in the karst legislations implemented in each region and the effect of time exposure to
human occupation to each karst terrain. Humans have intensively impacted the karst of southeast Italy
for thousands of years compared to only decades in west-central Florida. However, west-central Florida's
higher population density allows the region to reach disturbance levels comparable to those reached
over a longer period in Apulia. Similarly, Italian karst is more diverse than the karst found in west-central
Florida, creating an opportunity to test all the KDI indicators. Overall, major disturbances for southeast
Italy karst include quarrying, stone clearing, and the dumping of refuse into caves, while west-central
Florida suffers most from the infilling of sinkholes, soil compaction, changes in the water table, and
vegetation removal. The application of the KDI allows a benchmark of disturbance to be established and
later revisited to determine the changing state of human impact for a region. The highlighting of certain
indicators that recorded high levels of disturbance also allows regional planners to allocate resources in
a more refined manner.
Calò F. & Parise M., 2009, Waste management and problems of groundwater pollution in karst environments in the context of a post-conflict scenario_ the case of Mostar (Bosnia Herzegovina),
Habitat international 33 (2009): 63–72.,
Polemio M.; Casarano D.; Limoni P. P., 2009, Karstic aquifer vulnerability assessment methods and results at a test site (Apulia, southern Italy),
Natural hazards and earth system sciences (Print) 9 (2009): 1461–1470. doi_10.5194/nhess-9-1461-2009,
DOI: 10.5194%2Fnhess-9-1461-2009
Abstract
Karstic aquifers are well known for their vulnerability to groundwater contamination. This is due to ...
Karstic aquifers are well known for their vulnerability to groundwater contamination. This is due to characteristics such as thin soils and point recharge in dolines, shafts, and swallow holes. In karstic areas, groundwater is often the only freshwater source. This is the case of the Apulia region (south-eastern Italy), where a large and deep carbonate aquifer, affected by karstic and fracturing phenomena, is located. Several methods (GOD, DRASTIC, SINTACS, EPIK, PI, and COP) for the assessment of the intrinsic vulnerability (Iv) were selected and applied to an Apulian test site, for which a complete data set was set up. The intrinsic vulnerability maps, produced using a GIS approach, show vulnerability from low to very high. The maximum vulnerability is always due to karstic features. A comparison approach of the maps is proposed. The advantages and disadvantages of each method are discussed. In general terms, three groups can be distinguished. The GOD method is useful for mapping large areas with high vulnerability contrasts. DRASTIC and SINTACS are anytype aquifer methods that have some limitations in applications to karstic aquifers, especially in the case of DRASTIC. EPIK, PI, and COP, which were designed to be applied to carbonate or karstic aquifers, supply affordable results, highly coherent with karstic and hydrogeological features, and reliable procedures, especially in the case of PI and COP. The latter appears simpler to apply and more flexible in considering the role of climatic parameters. If Iv of each method is considered, the highest variability is observed in cells in the neighbourhood of karstic features. In these spatial domains, additional efforts to define more reliable and global methods are required.
Salvador Sanchis M.P.; Torri D.; Borselli L.; Bryan R.; Poesen J.; Yañez M. S.; Cremer C., 2009, Estimating parameters of the channel width-flow discharge relation using rill and gully channel junction data,
Earth surface processes and landforms (Print) 34 (2009): 2023–2030. doi_10.1002/esp.1887,
DOI: 10.1002%2Fesp.1887
Abstract
Eroding channels can usually be characterized by a power relationship between channel width (W) and ...
Eroding channels can usually be characterized by a power relationship between channel width (W) and channel discharge (Q). This paper examines the WQ relation using a recently developed channel junction approach to extend the validity of the WQ relation and to develop a procedure for estimating the WQ exponent and proportionality coefficient. Rill and gully channel data from the literature, and new data collected in different badland areas and in a few forest mountain streams, are analysed. Analysis shows that the WQ relation for channel width collected in badlands and forests agrees with trends observed for cropland. The exponent increases with increasing channel width in a continuous fashion rather than in a step-like way and tends to a maximum whose value ranges between 0.5 and 0.6.
The proportionality coefficient can be split into two terms, one expressing the case in which an eroding channel can broaden, the other reflecting the difficulties in removing the less erodible clods or rock fragments from the channel bed. Its splitting allows the development of a more correct form of the WQ relation in agreement with modern approaches of channel geometry_ one part has the dimension of a discharge and makes the power base dimensionless, while the other brings the dimension of a length, needed for the channel width, into the WQ relation. The interpretation of the two constants is Supported by data collected in rainfall-runoff simulation experiments conducted in the field. Values characterizing the two constants in some environments are also given. Nevertheless the approach is not sufficiently parameterized yet to be of practical use (e.g. in models or for estimating peak discharge in areas where rill channels have formed).
CAPRA, L., BORSELLI, L., VARLEY, N., GAVILANES-RUIZ, J.C, NORINI, G., SAROCCHI, D., CABALLERO, L., CORTES, A, 2009, Rainfall- triggered lahars at Volcán de Fuego Colima Volcano (Colima, Mexico): frequency and surface hydro-repellency as initiation processes,
Journal of volcanology and geothermal research (2009).,
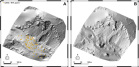
Baldo M., Bicocchi C., Chiocchini U., Giordan D. and Lollino G., 2009, LIDAR monitoring of mass wasting processes_ The Radicofani landslide, Province of Siena, Central Italy,
Geomorphology (Amst.) 105 (2009): 193–201. doi_10.1016/j.geomorph.2008.09.015,
DOI: 10.1016%2Fj.geomorph.2008.09.015
Abstract
The Radicofani Basin, stretching about 30 km NWSE, is an intra-Central Apennine basin connected to ...
The Radicofani Basin, stretching about 30 km NWSE, is an intra-Central Apennine basin connected to PliocenePleistocene extensional tectonics. It consists of an Early to Middle Pliocene succession including essentially shelf pelites. In the Radicofani area, province of Siena (Tuscany region), morphodynamic processes are very frequent with widespread badlands and rapidly evolving mudflows. In order to evaluate the general instability of the Radicofani area, geological and geomorphological surveys were carried out. The 1954, 1990 and 2003 aerial surveys allowed a comparison of the changes in the various morphological aspects of the study area, which suggested an increase in slope instability with time. A new complex translational landslide evolving into mudflows, activated during the winter of 2003, was monitored using an experimental system based on terrestrial LIDAR (Light Detection and Ranging) and GPS (Global Positioning System) technologies. This system allowed the monitoring of the morphologic and volumetric evolution of the landslide. A comparison of the monitoring data of October 2004, June 2005, May 2006 and May 2007 points out that the evolution is characterised by the sliding of displaced materials. A volume of about 1300 m3 of materials was removed during the period 20042005, 300 m3 for 20052006, and 400 m3 for 20062007. The greater initial mass movement probably reflects a greater static imbalance during the early period of landslide movement and increased rainfall. Therefore, the proposed monitoring system methodology allows the numerical evaluation of the landslide morphological evolution and to validate the landslide evolution model based on geological and geomorphological field surveys.
F. Luino, C. G. Cirio, M. Biddoccu, A. Agangi, W. Giulietto, F. Godone and G. Nigrelli, 2009, Application of a model to the evaluation of flood damage,
Geoinformatica (Dordrecht) 13 (2009): 339–353. doi_10.1007/s10707-008-0070-3,
DOI: 10.1007%2Fs10707-008-0070-3
Abstract
This paper presents the initial results of a common methodology for the evaluation of damage ...
This paper presents the initial results of a common methodology for the evaluation of damage produced by a flood. A model has been developed for flood damage estimation based on a geographic information system (GIS). It could be used by land administration bodies and insurance companies to manage flood-related damage data. The model simulates flood scenarios and evaluates expected economic losses from the impact of floodwaters on exposed elements, through the application of a computational model elaborated by GIS. During the development of the model, the Boesio Stream, a small watercourse flowing into Lake Maggiore (Lombardy, northern Italy) which was recently affected by a flash flood, was used as case study to test and calibrate the methodology. The method could be used either as a forecasting tool to define event scenarios, utilizing data from events simulated with a hydraulic model, or for real-time damage assessment after a disaster. The approach is suitable to large-area damage assessment and could be appropriate for land use planning, civil protection and risk mitigation.
Notarnicola C., Ventura B., Casarano D., Posa F., 2009, Cassini Radar Data_ Estimation of Titan’s Lake Features by Means of a Bayesian Inversion Algorithm,
IEEE transactions on geoscience and remote sensing 47-5 (2009): 1503–1511.,
Abstract
The analysis derived from the Cassini SAR imagery
reflects the complex Titan's surface morphology with a ...
The analysis derived from the Cassini SAR imagery
reflects the complex Titan's surface morphology with a wide range
of backscattering coefficients and peculiar features such as periodic
structures and lakelike features, which were observed on
July 22, 2006, when polar areas were first imaged, and are considered
good candidates to be filled with liquid hydrocarbons. In this
paper, themodeling description of lakes is addressed bymeans of a
double-layer model which considers an upper liquid-hydrocarbon
layer and a lower layer compatible with the radar response of
the neighboring areas. This model is introduced into a Bayesian
framework for the purpose of inferring the likely ranges of some
parameters and, in particular, of the optical thickness of the
hypothesized liquid-hydrocarbon layer and of the wind speed. The
main idea is to use the information contained in the parameter
probability density function, which describes how probability is
distributed among the different values of parameters according
to the various scenarios considered. The analysis carried out on
lakes and surrounding areas on flybys T16 and T19 determines
optical thickness values from 0.2 to 6. For T25 flyby, the inferred
values of optical thickness indicate that a limit value of optical
thickness may be 9. Considering that, beyond these values, the
signal from the bottom layer is completely attenuated, information
on the wind speed on the upper layer can be inferred. The found
mean values of wind speed are around 0.2-0.3 m/s according to
different hypotheses on the upper layer dielectric constant.
Perumal M., Sahoo B., Moramarco T., Barbetta S., 2009, Multilinear Muskingum method for stage-hydrograph routing in compound channels,
Journal of hydrologic engineering 14(7) (2009): 663–670.,
Marchi, L., Cavalli, M., Sangati, M., Borga, M., 2009, Hydrometeorological controls and erosive response of an extreme alpine debris flow,
Hydrological processes (Print) 23 (2009): 2714–2727. doi_10.1002/hyp.7362,
DOI: 10.1002%2Fhyp.7362
Abstract
On 29 August, 2003, an intense convective storm system affected the Fella River basin, in ...
On 29 August, 2003, an intense convective storm system affected the Fella River basin, in the eastern Italian Alps, producing
rainfall peaks of approximately 390 mm in 12 h. The storm triggered an unusually large debris flow in the ungauged Rio
Cucco basin (0.65 km2), with a volume of approximately 78 000 m3. The analysis of the time evolution of the rainstorm over
the basin has been based on rainfall estimates from radar observations and data recorded by a raingauge network. Detailed
geomorphological field surveys, carried out both before and after the flood of August 2003, and the application of a distributed
hydrological model have enabled assessment of flood response, estimation of erosion volumes and sediment supply to the
channel network. The accounts of two eyewitnesses have provided useful elements for reconstructing the time evolution and
the flow processes involved in the event. Liquid peak discharge estimates cluster around 20 m3 s-1 km-2, placing this event
on the flood envelope curve for the eastern Italian Alps. The hydrological analysis has shown that the major controls of the
flood response were the exceptional cumulated rainfall amount, required to exceed the large initial losses, and the large rainfall
intensities at hourly temporal scales, required to generate high flood response at the considered basin scale. Observations on the
deposits accumulated on the alluvial fan indicate that, although the dominant flow process was a debris flow, sheetflood also
contributed to fan aggradation and fluvial reworking had an important role in winnowing debris-flow lobes and redistributing
sediment on the fan surface. This points out to the large discharge values during the recession phase of the flood, implying
an important role for subsurface flow on runoff generation of this extreme flash flood event.
Trevisani, S.; Cavalli, M.; Marchi, L., 2009, Variogram maps from LiDAR data as fingerprints of surface morphology on scree slopes.,
Natural hazards and earth system sciences (Print) 9 (2009): 129–133. doi_10.5194/nhess-9-129-2009,
DOI: 10.5194%2Fnhess-9-129-2009
Abstract
Herein, an aerial LiDAR topographic dataset is analysed and interpolated by means of geostatistical techniques ...
Herein, an aerial LiDAR topographic dataset is analysed and interpolated by means of geostatistical techniques in order to examine the morphology of a scree slope area in the Eastern Italian Alps. The LiDAR-derived digital terrain model (DTM) is analysed using variogram maps as spatial continuity indexes. This allowed for evaluation of the reproduction of spatial variability of topography and for the characterization and comparison of different morphological features occurring in the study site. The results indicate that variogram maps efficiently synthesise the spatial variability of topography in a local search window, representing suitable "fingerprints" of surface morphology.
Eric Gaume; Valerie Bain; Pietro Bernardara; Olivier Newinger; Mihai Barbuc; Allen Bateman; Lotta Bla?kovicová; Günter Blöschl; Marco Borga; Alexandru Dumitrescu; Ioannis Daliakopoulos; Joachim Garcia; Anisoara Irimescu; Silvia Kohnova; Aristeidis Koutroulis; Lorenzo Marchi; Simona Matreata; Vicente Medina; Emanuele Preciso; Daniel Sempere-Torres; Gheorghe Stancalie; Jan Szolgay; Ioannis Tsanis; David Velasco; Alberto Viglione, 2009, A compilation of data on European flash floods.,
Journal of hydrology (Amst.) 367 (2009): 70–78. doi_10.1016/j.jhydrol.2008.12.028,
DOI: 10.1016%2Fj.jhydrol.2008.12.028
Abstract
Flash floods are one of the most significant natural hazards in Europe, causing serious risk ...
Flash floods are one of the most significant natural hazards in Europe, causing serious risk to life and
destruction of buildings and infrastructure. This type of flood, often affecting ungauged watersheds,
remains nevertheless a poorly documented phenomenon. To address the gap in available information,
and particularly to assess the possible ranges for peak discharges on watersheds with area smaller than
500 km2 and to describe the geography of the hazard across Europe, an intensive data compilation has
been carried out for seven European hydrometeorological regions. This inventory is the first step towards
an atlas of extreme flash floods in Europe. It contains over 550 documented events. This paper aims at
presenting the data compilation strategy, the content of the elaborated data base and some preliminary
data analysis results. The initial observations show that the most extreme flash floods are greater in magnitude
in the Mediterranean countries than in the inner continental countries and that there is a strong
seasonality to flash flood occurrence revealing different climatic forcing mechanisms in each region.
Mao M.; Cavalli M.; Comiti F.; Marchi L.; Lenzi M.A.; Arattano M., 2009, Sediment transfer processes in two Alpine catchments of contrasting morphological settings,
Journal of hydrology (Amst.) 364 (2009): 88–98. doi_10.1016/j.jhydrol.2008.10.021,
DOI: 10.1016%2Fj.jhydrol.2008.10.021
Abstract
Coarse sediment transport processes in steep headwater streams may vary between bedload and debris
flows events, ...
Coarse sediment transport processes in steep headwater streams may vary between bedload and debris
flows events, depending on basin geomorphology and sediment supply. This paper compares two small
catchments (drainage area 4-5 km2) located in the Eastern Italian Alps where the dominant sediment
transport processes differ substantially, i.e., debris flows in the Moscardo Torrent and bedload events
in the Rio Cordon. The two basins were selected because they provided the unique opportunity to analyze
long-term data of debris flow and bedload volumes, respectively. The two basins are compared in terms
of peak discharge, event duration, and magnitude-frequency characteristics of transported sediment volumes.
Additional bedload data from two more Alpine experimental basins are also considered. The results
show that, for comparable recurrence intervals, debris flow volumes are 2-3 orders of magnitude larger
than bedload volumes. This contrasting sediment transfer activity can be attributed to different basin and
channel morphologies, which are analyzed in terms of sediment supply conditions, longitudinal profiles
and slope-area curves.
Vianello A.; Cavalli M.; Tarolli P., 2009, LiDAR-derived slopes for headwater channel network analysis.,
Catena (Cremling.) 76 (2009): 97–106. doi_10.1016/j.catena.2008.09.012,
DOI: 10.1016%2Fj.catena.2008.09.012
Abstract
Slope is one of the most important distinguishing features for channel morphology. Variations in the ...
Slope is one of the most important distinguishing features for channel morphology. Variations in the computation of slope from a digital elevation model can affect a wide range of hydrogeomorphically derived applications. We compare different methods for computing channel slope using LiDAR-derived digital terrain models (DTMs) with varying resolutions. We chose a headwater basin of the Eastern Italian Alps, characterized by a dense ephemeral colluvial network and a main alluvial channel as our study area. The identified alluvial morphologies are characteristic of steep mountain streams, namely, cascades and step pools. Field surveys were carried out along the main channel and in some small tributaries. Results indicate that a single method for slope calculation cannot estimate channel slope at the hydrographic network scale. The differential geometry approach for slope calculation tends to overestimate field-surveyed channel slope values for all the DTM resolutions (1, 2, 5 m). When a trigonometric approach for slope calculation is applied, 2 and 5 m DTM resolutions give more consistent results. Nevertheless, a reliable channel slope can be derived from a DTM with an appropriate resolution by choosing a suitable method only after considering the channel width.
A. Piorr; F. Ungaro; A. Ciancaglini; K. Happe; A. Sahrbacher; C. Sattler; S. Uthes; P. Zander, 2009, Integrated assessment of future CAP policies_ land use changes, spatial patterns and targeting,
Environmental science & policy 12 (2009): 1122–1136. doi_10.1016/j.envsci.2009.01.001,
DOI: 10.1016%2Fj.envsci.2009.01.001
Abstract
The recent and upcoming reforms of the Common Agricultural Policies (CAPs) aim at strengthening the ...
The recent and upcoming reforms of the Common Agricultural Policies (CAPs) aim at strengthening the multifunctional role of agriculture, acknowledging the differences in
economic, environmental and social potentials within European regions. This paper presents results from an integrated assessment of existing and future policies within the
framework set up in the FP6 EU project MEA-Scope. Spatial explicit procedures allow for the MEA-Scope modelling tools to provide information related to regional, environmental and
socio-economics settings. The impact of different policy scenarios on structural change, land abandonment and cropping pattern of typical farms has been assessed based on linked
agent-based (ABM) and Linear Programming (LP) models at regional and farm scale for two study areas. For the German case study area Ostprignitz-Ruppin (OPR), the issue of policy
targeting has been addressed by relating non-commodity outputs (NCOs) to soil quality and protection status. For the Italian case study area (Mugello), changes in landscape patterns in
terms of increased fragmentation or homogeneity as affected by changes in agricultural intensity have been analysed using semivariance analysis. The spatial explicit approach
highlighted the relevance of case study research in order to identifying response structures and explaining policy implementation patterns.
Tagliavini F.; Reichenbach P.; Maragna D.; Guzzetti F.; Pasuto A., 2009, Comparison of 2-D and 3-D Computer Models for the M. Salta Rock Fall, Vajont Valley, northern Italy.,
Geoinformatica (Dordrecht) 13 (2009): 323–337.,
Van Den Eeckhaut, M.; Reichenbach P.; Guzzetti F.; Rossi M.; Poesen J., 2009, Combined landslide inventory and susceptibility assessment based on different mapping units_ an example from the Flemish Ardennes, Belgium.,
Natural hazards and earth system sciences (Print) 9 (2009): 507–521. doi_10.5194/nhess-9-507-2009,
DOI: 10.5194%2Fnhess-9-507-2009
Abstract
For a 277 km(2) study area in the Flemish Ardennes, Belgium, a landslide inventory and ...
For a 277 km(2) study area in the Flemish Ardennes, Belgium, a landslide inventory and two landslide susceptibility zonations were combined to obtain an optimal landslide susceptibility assessment, in five classes. For the experiment, a regional landslide inventory, a 10 m x 10 m digital representation of topography, and lithological and soil hydrological information obtained from 1_ 50 000 scale maps, were exploited. In the study area, the regional inventory shows 192 landslides of the slide type, including 158 slope failures occurred before 1992 (model calibration set), and 34 failures occurred after 1992 (model validation set). The study area was partitioned in 2.78 x 10(6) grid cells and in 1927 topographic units. The latter are hydro-morphological units obtained by subdividing slope units based on terrain gradient. Independent models were prepared for the two terrain subdivisions using discriminant analysis. For grid cells, a single pixel was identified as representative of the landslide depletion area, and geo-environmental information for the pixel was obtained from the thematic maps. The landslide and geo-environmental information was used to model the propensity of the terrain to host landslide source areas. For topographic units, morphologic and hydrologic information and the proportion of lithologic and soil hydrological types in each unit, were used to evaluate landslide susceptibility, including the depletion and depositional areas. Uncertainty associated with the two susceptibility models was evaluated, and the model performance was tested using the independent landslide validation set. An heuristic procedure was adopted to combine the landslide inventory and the susceptibility zonations. The procedure makes optimal use of the available landslide and susceptibility information, minimizing the limitations inherent in the inventory and the susceptibility maps. For the established susceptibility classes, regulations to link terrain domains to appropriate land rules are proposed.
Salvati P. ; Balducci V. ; Bianchi C. ; Guzzetti F. ; Tonelli G., 2009, A WebGIS for the Dissemination of Information on Historical Landslides and Floods in Umbria, Italy.,
Geoinformatica (Dordrecht) 13 (2009): 305–322. doi_10.1007/s10707-008-0072-1,
DOI: 10.1007%2Fs10707-008-0072-1
Abstract
A web site was designed to disseminate new information on historical landslides and floods in ...
A web site was designed to disseminate new information on historical landslides and floods in Umbria, central Italy. The historical information was compiled through a thorough review of existing catalogues of historical landslide and flood events, supplemented by an extensive search of local historical archives and chronicles, for the period before 1900. The new catalogue lists 1983 landslide events in the period from 1139 to 2001, and 1956 flood events in the period from 860 to 2001. In the considered period, in Umbria there were at least 1,531 sites affected one or more times by landslides, and at least 1,071 sites affected one or more times by inundations. The seasonal distribution of landslides and inundations was found different before and after 1900, most probably because of incompleteness of the historical record prior to 1900. WebGIS technology was used to disseminate the geographical and thematic information on historical landslides and floods in Umbria. The GIS-based web site is aimed at a diversified audience of experts and private citizens seeking information on geo-hydrological hazards in Umbria
Brocca L., Melone F., Moramarco T., Singh V.P., 2009, Assimilation of observed soil moisture data in storm rainfall-runoff modeling,
Journal of hydrologic engineering 14 (2009): 153–165. doi_10.1061/(ASCE)1084-0699(2009)14:2(153),
DOI: 10.1061%2F(ASCE)1084-0699(2009)14:2(153)
Abstract
Estimation of antecedent wetness conditions is one of the most important aspects of storm rainfall-runoff ...
Estimation of antecedent wetness conditions is one of the most important aspects of storm rainfall-runoff modeling. This study investigated the use of observations of near-surface soil moisture carried out in a small experimental plot to estimate wetness conditions of five nested catchments, from 13 to 137 km2 in area, in Central Italy, including the plot itself. In particular, the relationship between the observed degree of saturation, ?e, and the potential maximum retention parameter, S, of the soil conservation service-curve number (SCS-CN) method for abstraction was investigated using 15 rainfall-runoff events (ten for calibration and five for verification) that occurred in the period 2002-2005. Two antecedent precipitation indices (API) and one base flow index (BFI) were also considered for the estimation of wetness conditions. When interpreting S as the mean soil water deficit of the catchment, an inverse linear relationship with ?e was found with the coefficient of determination decreasing with catchment area, but still significant for the largest catchment. On the contrary, the reliability of regression increased with catchment area when BFI was employed. Both API indices led to poor results for all investigated catchments. The accuracy of the modified SCS-CN method, i.e., incorporating ?e for the estimation of S, coupled with a geomorphological unit hydrograph transfer function, was tested in simulating the catchment response. Assimilating the observed soil moisture in the rainfall-runoff model, both the runoff volume and the peak discharge were well predicted with average Nash-Sutcliffe efficiency greater than 90% in the verification phase.
Brocca L., Melone F., Moramarco T., Morbidelli R., 2009, Antecedent wetness conditions based on ERS scatterometer data,
Journal of hydrology (Amst.) 364 (2009): 73–87.,
Brocca L., Melone F., Moramarco T., Morbidelli R., 2009, Soil moisture temporal stability over experimental areas of Central Italy,
Geoderma (Amst.) 148 (2009): 364–374. doi_10.1016/j.geoderma.2008.11.004,
DOI: 10.1016%2Fj.geoderma.2008.11.004
Abstract
The knowledge of the near-surface soil moisture spatio-temporal pattern is an important issue for hydrological ...
The knowledge of the near-surface soil moisture spatio-temporal pattern is an important issue for hydrological and climatic studies. Because of its high spatial and temporal variability, soil moisture monitoring scheme was investigated in view of its application in rainfall-runoff modelling. To this end, through a portable Time Domain Reflectometer, 35 measurement campaigns were carried out at three experimental areas ranging in extension from nearly 400 to 9000 m2 and located in central Italy. Based on the results of the temporal stability analysis, for each experimental site the location able to accurately represent the field-mean soil moisture was detected in terms of root mean square error, less than 2%. Moreover, the location was also found to be linked to topographical characteristics, primarily the upslope drainage area but also the slope and the elevation. This aspect allowed both to identify these locations also in ungauged areas and to better understand processes affecting the soil moisture spatial pattern. By matching the temporal pattern observed at the different experimental sites, factors affecting the soil moisture spatio-temporal behavior were analyzed. Results showed that the soil moisture monitored in a few locations, better if previously identified as qrepresentativeq, provides useful information not only at the plot scale (~10,000 m2) but also over large areas that are of up most importance for hydrological applications.
Tayfur G., Barbetta S., Moramarco T., 2009, Genetic algorithm based discharges estimation ai sites receiving lateral inflows,
Journal of hydrologic engineering 14 (2009): 463–474. doi_10.1061/(ASCE)HE.1943-5584.0000009,
DOI: 10.1061%2F(ASCE)HE.1943-5584.0000009
Abstract
The genetic algorithm GA technique is applied to obtain optimal parameter values of the standard ...
The genetic algorithm GA technique is applied to obtain optimal parameter values of the standard rating curve model RCM
for predicting, in real time, event-based flow discharge hydrographs at sites receiving significant lateral inflows. The standard RCM uses
the information of discharge and effective cross-sectional flow area at an upstream station and effective cross-sectional flow area wave
travel time later at a downstream station to predict the flow rate at this last site. The GA technique obtains the optimal parameter values
of the model, here defined as the GA-RCM model, by minimizing the mean absolute error objective function. The GA-RCM model was
tested to predict hydrographs at three different stations, located on the Upper Tiber River in central Italy. The wave travel times
characterizing the three selected river branches are, on the average, 4, 8, and 12 h. For each river reach, seven events were employed, four
for the model parameters' calibration and three for model testing. The GA approach, employing 100 chromosomes in the initial gene pool,
75% crossover rate, 5% mutation rate, and 10,000 iterations, made the GA-RCM model successfully simulate the hydrographs observed
at each downstream section closely capturing the trend, time to peak, and peak rates with, on the average, less than 5% error. The model
performance was also tested against the standard RCM model, which uses, on the contrary to the GA-RCM model, different values for the
model parameters and wave travel time for each event, thus, making the application of the standard RCM for real time discharge
monitoring inhibited. The comparative results revealed that the RCM model improved its performance by using the GA technique in
estimating parameters. The sensitivity analysis results revealed that at most two events would be sufficient for the GA-RCM model to
obtain the optimal values of the model parameters. A lower peak hydrograph can also be employed in the calibration to predict a higher
peak hydrograph. Similarly, a shorter travel time hydrograph can be used in GA to obtain optimal model parameters that can be used to
simulate floods characterized by longer travel time. For its characteristics, the GA-RCM model is suitable for the monitoring of discharge
in real time, at river sites where only water levels are observed.
Guzzetti F.; Ardizzone F.; Cardinali M.; Rossi M.; Valigi D., 2009, Landslide volumes and landslide mobilization rates in Umbria, central Italy.,
Earth and planetary science letters 279 (2009): 222–229. doi_10.1016/j.epsl.2009.01.005,
DOI: 10.1016%2Fj.epsl.2009.01.005
Abstract
A catalogue of 677 landslides of the slide type was selected from a global database ...
A catalogue of 677 landslides of the slide type was selected from a global database of geometrical measurements of individual landslides, including landslide area (A(L)) and volume (V(L)). The measurements were used to establish an empirical relationship to link A(L) (in m(2)) to V(L) (in m(3)). The relationship takes the form of a power law with a scaling exponent alpha=1.450, covers eight orders of magnitude ofAL and twelve orders of magnitude of V(L), and is in general agreement with existing relationships published in the literature. The reduced scatter of the experiential data around the dependency line, and the fact that the considered landslides occurred in multiple physiographic and climatic environments and were caused by different triggers, indicate that the relationship between V(L) and A(L) is largely independent of the physiographical setting. The new relationship was used to determine the volume of individual landslides of the slide type in the Collazzone area, central Italy, a 78.9 km(2) area for which a multi-temporal landslide inventory covering the 69-year period from 1937 to 2005 is available. In the observation period, the total volume of landslide material was V(LT)=4.78x10(7) m(3), corresponding to an average rate of landslide mobilization phi(L)= 8.8 mm, yr(-1). Exploiting the temporal information in the landslide inventory, the volume of material produced during different periods by new and reactivated landslides was singled out The wet period from 1937 to 1941 was recognized as an episode of accelerated landslide production. During this 5-year period, approximately 45% of the total landslide material inventoried in the Collazzone area was produced, corresponding to an average rate of landslide mobilization phi(L)= 54 mm yr(-1), six times higher than the long term rate. The volume of landslide material in an event or period was used as a proxy for the magnitude of the event or period, defined as the logarithm (base 10) of the total landslide volume produced during the event, or period. With this respect, the new relationship to link A(L) and V(L) is a starting point for the adoption of a quantitative, process based landslide magnitude scale for landslide events.
Brunetti M.T.; Guzzetti F.; Rossi M., 2009, Probability distributions of landslide volumes.,
Nonlinear processes in geophysics 16 (2009): 179–188.,
Stark C.P. & Guzzetti F., 2009, Landslide rupture and the probability distribution of mobilized debris volumes.,
Journal of geophysical research 114 (2009).,
PETRUCCI O.; POLEMIO M., 2009, The role of meteorological and climatic conditions in the occurrence of damaging hydro-geologic events in Southern Italy.,
Natural hazards and earth system sciences (Print) 9 (2009): 105–118. doi_10.5194/nhess-9-105-2009,
DOI: 10.5194%2Fnhess-9-105-2009
Abstract
Damaging Hydro-geologic Events (DHEs), defined as landslides and floods caused by heavy or prolonged rainfall, ...
Damaging Hydro-geologic Events (DHEs), defined as landslides and floods caused by heavy or prolonged rainfall, represent an important source of economic damages. We propose an approach to classify DHEs, considering 1) meteorological antecedent conditions, 2) the season during which the event occurs, 3) the return period of maximum daily rainfall triggering the event, 4) geographic sectors hit, 5) types of triggered damaging phenomena; and 6) induced damage.
We applied this approach to a case study of time series of DHEs that occurred over 85 years in Calabria (southern Italy). We analysed 13 DHEs that, between 1921 and 2005, triggered landslides, floods and secondary floods, causing severe damage and tens of causalities all over the Calabria region. During the analysed events, 64% of Calabria's municipalities suffered many types of damage. The most relevant rain phenomena and the largest damages were caused by the persistent effects of perturbations on Calabria, which were preceded by the appearance of low-pressure fields in two different areas located westwards.
We sorted the events into three types based on geographic damage distribution and types of triggered phenomena and induced damage. The first two types are characterised by similar severity levels, while the third shows the highest severity, in terms of both damage and victims. Independent of the type of event, the S-SE and E sectors of the region are the most frequently affected by DHEs. As regards human life, floods are the most dangerous type of phenomenon, causing the highest number of fatalities.
Our analysis indicates a decreasing frequency of DHEs during the study period, and an absence of the most severe type for more than 50 years. The number of victims is also decreasing over time.
PETRUCCI O., GULLA' G., 2009, A support Analysis Framwork for mass movement damage assessment_ applications to case studies in Calabria (Italy),
Natural hazards and earth system sciences (Print) 9 (2009): 315–326.,
Abstract
The analysis of data describing damage caused by mass movements in Calabria (Italy) allowed the ...
The analysis of data describing damage caused by mass movements in Calabria (Italy) allowed the organisation of the Support Analysis Framework (SAF), a spreadsheet that converts damage descriptions into numerical indices expressing direct, indirect, and intangible damage.
The SAF assesses damage indices of past mass movements and the potential outcomes of dormant phenomena re-activations. It is based on the effects on damaged elements and is independent of both physical and geometric phenomenon characteristics.
SAF sections that assess direct damage encompass several lines, each describing an element characterised by a value fixed on a relative arbitrary scale. The levels of loss are classified as_ L4_ complete; L3_ high; L2_ medium; or L1_ low. For a generic line l, the SAF multiplies the value of a damaged element by its level of loss, obtaining dl, the contribution of the line to the damage.
Indirect damage is appraised by two sections accounting for_ a) actions aiming to overcome emergency situations and b) actions aiming to restore pre-movement conditions. The level of loss depends on the number of people involved (a) or the cost of actions (b).
For intangible damage, the level of loss depends on the number of people involved.
We examined three phenomena, assessing damage using the SAF and SAFL, customised versions of SAF based on the elements actually present in the analysed municipalities that consider the values of elements in the community framework. We show that in less populated, inland, and affluent municipalities, the impact of mass movements is greater than in coastal areas.
The SAF can be useful to sort groups of phenomena according to their probable future damage, supplying results significant either for insurance companies or for local authorities involved in both disaster management and planning of defensive measures.
CHIARAVALLOTI F. and GABRIELE S., 2009, The Vibo Valentia flood and MSG rainfall evaluation,
Atmospheric research (Print) 93 (2009): 286–294. doi_10.1016/j.atmosres.2008.10.027,
DOI: 10.1016%2Fj.atmosres.2008.10.027
Abstract
In the Mediterranean area, flash-floods in small catchments are mainly due to deep convective
rainfalls which ...
In the Mediterranean area, flash-floods in small catchments are mainly due to deep convective
rainfalls which show both large spatial and temporal variability. For this reason the
reconstruction of the ground rainfall field is difficult and the use of rain gauges can prove
poor to depict convective events from a hydrological point of view. The geostationary satellite
MSG is a very important tool for monitoring the dynamic evolution of cloud structures above
the European area. In the infrared window many algorithms have been proposed to relate the
brightness temperature of the top of the convective cloud with rainfall. To explore more
possible applications of Meteosat image analysis, in evaluating areal rainfall in small basins, a
very deep convective event was analysed, which hit Vibo Valentia on 3 July 2006. Starting from
this deep convective event, the paper explores new possible relations between some
characteristics of infrared isotherm images and rainfall.
Polemio M.; Dragone V.; Limoni P.P., 2009, Monitoring and methods to analyse the groundwater quality degradation risk in coastal karstic aquifers (Apulia, Southern Italy),
Environmental geology (Berl.) 58 (2009): 299–312. doi_10.1007/s00254-008-1582-8,
DOI: 10.1007%2Fs00254-008-1582-8
Abstract
A multi-methodological approach based on monitoring and spatio-temporal analysis of groundwater quality changes is proposed. ...
A multi-methodological approach based on monitoring and spatio-temporal analysis of groundwater quality changes is proposed. The presented tools are simple, quick and cost-effective in order to be give service to all sorts of users.
The chief and simplest purpose of the monitoring network is the detection of the piezometric or potenziometric level in the aquifer. The spatial and multi-temporal analysis of usual chemical and physical data provides both an assessment of the spatial vulnerability of the aquifer to seawater intrusion, defining a salinity threshold between fresh groundwater and brackish groundwater, and of the water quality trend in terms of salinity. The evaluation of the salinity trend or of salinity-correlated parameters highlights the effects of groundwater mismanagement. The multiparameter logging provides a rapid groundwater quality classification for each well. The whole approach allows evaluating the effects of current management criteria and designing more appropriate management targets.
The Apulian karstic coastal aquifers have been selected as a case study (southern Italy). Three types of aquifer zones can be distinguished_ i) areas with low vulnerability to seawater intrusion, ii) areas with high vulnerability, and iii) areas with variable vulnerability in which the salt degradation largely depends on the ability to manage the well discharge. The water quality degradation caused by seawater intrusion appears to be a combined effect of an anomalous succession of drought periods observed from about 1980 onwards and increased groundwater pumping, particularly during drought periods. A management criterion based on aquifer zones is proposed.
O. PETRUCCI; A.A. PASQUA, 2009, A METHODOLOGICAL APPROACH TO CHARACTERISE LANDSLIDE PERIODS BASED ON HISTORICAL SERIES OF RAINFALL AND LANDSLIDE DAMAGE,
Natural hazards and earth system sciences (Print) 9 (2009): 1655–1670. doi_10.5194/nhess-9-1655-2009,
DOI: 10.5194/nhess-9-1655-2009
Abstract
Landslide Periods (LPs) are defined as periods, shorter than a hydrological year, during which one ...
Landslide Periods (LPs) are defined as periods, shorter than a hydrological year, during which one or more landslide damage events occur in one or more sectors of a study area. In this work, we present a methodological approach, based on the comparative analysis of historical series
of landslide damage and daily rainfall data, aiming to characterise the main types of LPs affecting selected areas. Cumulative rainfall preceding landslide activation is assessed for short (1, 2, 3, and 5 days), medium (7, 10, and 30 days) and long (60, 90, and 180 days) durations, and their Return Periods (RPs) are assessed and ranked into three classes (Class 1_ RP=5-10 years; Class 2_ RP=11-15; Class 3_ RP>15 years). To assess landslide damage, the Simplified Damage Index (SDI) is introduced. This represents classified landslide losses and is obtained by multiplying the value of the damaged element and the percentage of damage affecting it. The comparison of the RP of rainfall and the SDI
allows us to indentify the different types of LPs that affected the study area in the past and that could affect it again in the future.
The results of this activity can be used for practical purposes to define scenarios and strategies for risk management, to suggest priorities in policy towards disaster mitigation and preparedness and to predispose defensive measures and civil protection plans ranked according to the types of LPs that must be managed. We present an application, performed for a 39-year series of rainfall/landslide damage data and concerning a study area located in NE Calabria (Italy); in this case study, we identify four main types of LPs, which are ranked according to damage
severity.
Gullà Giovanni, 2009, Strategie di studio per la definizione di modelli di evoluzione dei versanti interessati da frane superficiali e veloci,
Geoitalia 2009 - "W2 - Strategie di studio per la definizione di modelli di evoluzione dei versanti interessati da frane superficiali e veloci", Rimini, 7 settembre 2009,