P. Reichenbach, I. Marchesini, M. Rossi, S. Peruccacci, M.T. Brunetti, IGME Team, DGPCE team, CDCP team, 2018, U-geohaz. Deliverable D4.2: Rockfalls tools and methods user assessment procedure,
2018,
Abstract
This document, which represents the second deliverable of WP4 "Tools and methods to support Early ...
This document, which represents the second deliverable of WP4 "Tools and methods to support Early Warning System for Rockfalls", describes the actions performed in the Activity 4.2 "User assessment".
The main goal of this task is the assessment of the project progress and of the results from the User perspective. It will be based on the SAFETY assessment procedure tailored to the specific characteristics of the U-Geohaz products, being applied in two phases_ first, during the product generation by providing a continuous feedback to identify the gaps between the user requirements and the delivered products. Then a final assessment of the products by taking into account the validation results and the feedback provided by the involved CPAs. The main outcome of the user assessment activity will be fundamental for the integration of the U-Geohaz products in the CP prevention procedures. A critical evaluation of the developed tools, methods and generated results to support Early Warning System for Rockfalls will be performed, including feedbacks and indications for possible improvements of to increase urban resilience.
S. Peruccacci, S. Gariano, M.T. Brunetti, M. Melillo, P. Reichenbach, I. Marchesini, M. Rossi, IGME Team, DGPCE team, CDCP team, 2018, U-geohaz. Deliverable D4.9: Preliminary rainfall thresholds for the Canary Island,
2018,
Abstract
The document, which represents the fourth deliverable of WP4 "Tools and methods to support Early ...
The document, which represents the fourth deliverable of WP4 "Tools and methods to support Early Warning System for Rockfalls", describes the actions performed in the Activity 4.5 "Rainfall thresholds for the possible initiation of rockfalls". The main goal of this activity is the definition of empirical rainfall thresholds for the possible initiation of rockfalls in the Canary Islands.
The report describes the preliminary empirical cumulated event rainfall - rainfall duration (ED) thresholds for the Gran Canaria and Tenerife test sites. For the purpose, an algorithm for the objective and reproducible reconstruction of rainfall events and of rainfall conditions responsible for rockfalls is used. A frequentist statistical method is adopted to define ED thresholds for different exceedance probabilities.
Ardizzone F., Bucci F_, Cardinali M., Fiorucci F., Pisano L., Reichenbach P., Santaloia F., Santangelo M., Salvati P_, Wasowski J., Zumpano V., 2018, VALUTAZIONE DEL RISCHIO DA FRANA PER DIECI CENTRI ABITATI DEL SUB-APPENNINO DAUNO – RELAZIONE METODOLOGICA WP6 (VALUTAZIONE INTEGRATA DI DISSESTI GEO-IDROLOGICI NEL TERRITORIO DELLA REGIONE PUGLIA, MODELLI INTERPRETATIVI DEI FENOMENI E DEFINIZIONE DI SOGLIE DI PIOGGIA PER IL POSSIBILE INNESCO DI FRANE SUPERFICIALI),
D06-01, 2018,
Abstract
Lo scopo di questo documento è quello di descrivere i criteri e le procedure per ...
Lo scopo di questo documento è quello di descrivere i criteri e le procedure per la
zonazione geomorfologica della pericolosità e del rischio da frana. Sarà illustrata la
metodologia, sviluppata dall'Istituto di Ricerca per la Protezione Idrogeologica (IRPI), per
la zonazione geomorfologica della pericolosità e del rischio da frana in aree urbanizzate
(Cardinali et al., 2002; Reichenbach et al., 2005). La metodologia ha come obiettivo la
perimetrazione delle aree soggette a rischio da frana e la valutazione dei livelli di rischio,
come richiesto dalla Legge 267/98 relativa alle "Misure urgenti per la prevenzione del
Rischio idrogeologico e a favore delle zone colpite da disastri franosi nella regione
Campania" (Gazzetta Ufficiale della Repubblica Italiana, 1998).
La metodologia proposta sarà applicata a 10 centri abitati selezionati in accordo con la
Regione Puglia. Per ogni centro abitato_ (i) verrà identificata l'estensione della area di
studio, (ii) verranno selezionate le frane e le zone limitrofe per le quali accertare la
pericolosità, e (iii) saranno individuati gli elementi vulnerabili per i quali verrà stimato il
rischio specifico.
In questo documento, sono inoltre illustrate le caratteristiche dell'archivio digitale che
dovrà essere realizzato e che conterrà tutti i dati e le informazioni necessarie alla
zonazione geomorfologica della pericolosità e del rischio da frana per i 10 centri abitati
selezionati.
Ardizzone F., Bucci F., Cardinali M., Fiorucci F., Reichenbach P., Salvati P_, Santangelo M., 2018, CRITERI PER LA INTERPRETAZIONE DELLE FRANE DA IMMAGINI AEREE E SATELLITARI WP5 (Valutazione integrata di dissesti geo-idrologici nel territorio della Regione Puglia, modelli interpretativi dei fenomeni e definizione di soglie di pioggia per il possibile innesco di frane superficiali),
D05-02, 2018,
Abstract
Il presente documento illustra le attività realizzate nell'ambito del WP5 dell'Accordo di
Collaborazione tra la Regione ...
Il presente documento illustra le attività realizzate nell'ambito del WP5 dell'Accordo di
Collaborazione tra la Regione Puglia e l'Istituto di Ricerca per la Protezione Idrogeologica
(IRPI) del Consiglio Nazionale delle Ricerche (CNR) per la "Valutazione Integrata di Dissesti
Geo - Idrologici nel Territorio della Regione Puglia, Modelli Interpretativi dei Fenomeni e
Definizione di Soglie di Pioggia per il possibile innesco di frane superficiali".
Il documento è stato realizzato nell'ambito del WP5_ Redazione di cartografia tematica su
frane nel Sub-Appennino Dauno, e descrive i "Criteri per la interpretazione delle frane da
immagini aeree e satellitari". Gli argomenti trattati riguardano_ (i) le principali tecniche per
l'identificazione delle frane, (ii) le caratteristiche delle tecniche di interpretazione di fotografie
aeree stereoscopiche (foto-interpretazione), (iii) i principali criteri per il riconoscimento,
l'interpretazione e la mappatura delle frane tramite l'uso di tecniche foto-interpretative
(elementi della foto-interpretazione).
Stefano Luigi Gariano (1), Raju Sarkar (2,3), Abhirup Dikshit (2), Kelzang Dorji (2), Maria Teresa Brunetti (1), Silvia Peruccacci (1), Massimo Melillo (1), 2018, Automatic calculation of rainfall thresholds for landslide occurrence in Chukha Dzongkhag, Bhutan,
Bulletin of engineering geology and the environment (Internet) (2018): 1–8. doi_10.1007/s10064-018-1415-2,
DOI: 10.1007%2Fs10064-018-1415-2
Abstract
Bhutan is highly prone to landslides, particularly during the monsoon season. Several landslides often occur ...
Bhutan is highly prone to landslides, particularly during the monsoon season. Several landslides often occur along the Phuentsholing-Thimphu highway, a very important infrastructure for the country. Worldwide, empirical rainfall thresholds represent a widely used tool to predict the occurrence of rainfall-induced landslides. Nevertheless, no thresholds are currently designed and proposed for any region in Bhutan. In this work, we define empirical cumulated event rainfall-rainfall duration thresholds for the possible initiation of landslides using information on 269 landslides that occurred between 1998 and 2015 along the 90-km highway stretch between the towns of Phuentsholing and Chukha, in southwestern Bhutan, and daily rainfall measurements obtained from three rain gauges. For this purpose, we apply a consolidated frequentist method and use an automatic tool that identifies the rainfall conditions responsible for the failures and calculates thresholds at different exceedance probabilities and the uncertainties associated with them. Analyzing rainfall and landslide data, we exclude from the analysis all the landslides for which the rainfall trigger is not certain, so we reduce the number of landslides from 269 to 43. The calculated thresholds are useful to identify the triggering conditions of rainfall-induced landslides and to predict the occurrence of the failures in the study area, which is, to date, poorly studied. These rainfall thresholds might be implemented in an early warning system, in order to reduce the risk posed by these phenomena to the population living and traveling along the investigated road stretch.
H. Tanyas (1), M. Rossi (2), M. Alvioli (2), C. J. van Westen (1), I. Marchesini (2), 2018, A global slope unit-based method for the near real-time prediction of earthquake-induced landslides,
Geomorphology (Amst.) 327 (2018): 126–146. doi_10.1016/j.geomorph.2018.10.022,
DOI: 10.1016%2Fj.geomorph.2018.10.022
Abstract
Rapid assessment of spatial distribution of earthquake-induced landslides could provide valuable information in the emergency ...
Rapid assessment of spatial distribution of earthquake-induced landslides could provide valuable information in the emergency response phase. Previous studies proposed global analyses with the aim of predicting earthquake-induced landslide distributions in near real-time. However, in all those studies, mapping units are constituted by pixels, which do not reflect homogeneously distributed physical property for a given terrain unit and whose size do not match the resolution of existing thematic data at global scale. Moreover, none of the existing analyses considers sampling balance between different inventories or categorizing the inventories to construct a training set with higher statistical representativeness. We develop an improved global statistical method to address these drawbacks. We use slope units, which are terrain partitions attributed to similar hydrological and geomorphological conditions and to processes that shape natural landscapes. A set of 25 earthquake-induced landslide-events are selected and categorized based on the similarity between causal factors to determine the most relevant training set to make a prediction for a given landslide-event. As a result, we develop a specific model for each category. We sample an equal number of landslide points from each inventory to overcome the dominance of some inventories with large landslide population. We use seven independent thematic variables for both categorizing the inventories and modeling, based on logistic regression. The results show that categorizing landslide-events introduces a remarkable improvement in the modeling performance of many events. The categorization of existing inventories can be applied within any statistical, global approach to earthquake-induced landslide events. The proposed categorization approach and the classification performance can be further improved with the acquisition of new inventory maps.
Esposito G, Mondini AC, Marchesini I, Reichenbach P, Salvati P, Rossi M., 2018, An example of SAR-derived image segmentation for landslides detection,
Open Source Geospatial Research & Education Symposium (OGRS2018), Lugano (Switzerland), 9-11 October 2018,
Abstract
A rapid assessment of the areal extent of landslide disasters is one of the main ...
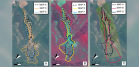
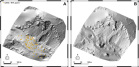
A rapid assessment of the areal extent of landslide disasters is one of the main challenges facing by the scientific community. Satellite radar data represent a powerful tool for the rapid detection of landslides over large spatial scales, even in case of persistent cloud cover. To define landslide locations, radar data need to be firstly pre-processed and then elaborated for the extraction of the required information. Segmentation represents one of the most useful procedures for identifying land cover changes induced by landslides. In this study, we present an application of the i.segment module of GRASS GIS software for segmenting radar-derived data. As study area, we selected the Tagari River valley in Papua New Guinea, where massive landslides were triggered by a M7.5 earthquake on February 25, 2018. A comparison with ground truth data revealed a suitable performance of i.segment. Particular segmentation patterns, in fact, resulted in the areas affected by landslides with respect to the external ones, or to the same areas before the earthquake. These patterns highlighted a relevant contrast of radar backscattering values recorded before and after the landslides. With our procedure, we were able to define the extension of the mass movements that occurred in the study area, just three days after the M7.5 earthquake.
F. Ardizzone (1), F. Bucci (1), M. Cardinali (1), F. Fiorucci (1), M. Santangelo (1), M. Alvioli (1), L. Pisano (2), V. Zumpano (2), 2018, Metodologia per la realizzazione degli stereo-blocchi per l’interpretazione di immagini aeree stereoscopiche – WP5,
2018,
Abstract
Metodologia per la realizzazione degli stereo-blocchi per l'interpretazione di immagini aeree stereoscopiche - WP5 ...
Metodologia per la realizzazione degli stereo-blocchi per l'interpretazione di immagini aeree stereoscopiche - WP5
Faith E. Taylor 1, Bruce D. Malamud 1, Annette Witt 2, Fausto Guzzetti 3, 2018, Landslide shape, ellipticity and length-to-width ratios,
Earth surface processes and landforms (Online) 43 (2018): 3164–3189. doi_10.1002/esp.4479,
DOI: 10.1002%2Fesp.4479
Abstract
This paper presents a new methodology to systematically quantify the shape of landslides by their ...
This paper presents a new methodology to systematically quantify the shape of landslides by their ellipticity (eL) and
length-to-width ratio (?L), along with variability in these measures over different geomorphic settings. Two large substantially complete
triggered-event landslide inventories (source area and runout) are used_ (i) 11 111 earthquake-triggered landslides (1994
Northridge, USA); and (ii) 9594 rainfall-triggered landslides (1998, Guatemala). Three methods are trialled to abstract landslide
shapes to ellipses. The best method fits a convex hull to each landslide shape, approximates an ellipse with the equivalent convex
hull area and perimeter, and scales this ellipse to match the original landslide area. An ellipticity index (eL) is used based on the intersection
of the original landslide shape and the elliptical approximation. We consider an ellipse a reasonable approximation of
landslide shape if eL >= 0.5 (>80% of landslides in each of the two landslide inventories). Landslides with eL < 0.5 reflect processes
such as coalescence. We calculate for each landslide an ellipse length-to-width ratio (?E), finding 1.2 <= ?E <= 15.1. The statistical distributions
of ?E are examined for ten categories of landslide area (AL). An inverse-Gamma probability density function is found to be a
good statistical model for landslide ?E, with model parameters dependent on landslide area category. As landslide area AL increases,
?E tends to decrease for the Northridge (earthquake-triggered) inventory and increase for Guatemala (rainfall-triggered). In three additional
(rainfall-triggered) landslide inventories, ?E trends are similar to Guatemala. Our findings show that (i) an ellipse is a reasonable
model for >80% of landslide shapes across different geomorphic settings, (ii) those landslides significantly deviating from an
ellipse can be related to landscape processes, (iii) the length-to-width ratios of ellipses are non-normally distributed, with implications
for modelling landslide hazard and risk. Supporting information includes code so that the new methodology may be applied
more widely.
Roccati, Anna; Faccini, Francesco; Luino, Fabio; Turconi, Laura; Guzzetti, Fausto, 2018, Rainfall events with shallow landslides in the Entella catchment, Liguria, northern Italy,
Natural hazards and earth system sciences (Print) 18 (2018): 2367–2386. doi_10.5194/nhess-18-2367-2018,
DOI: 10.5194%2Fnhess-18-2367-2018
Abstract
In recent decades, the Entella River basin, in the Liguria Apennines, northern Italy, was hit ...
In recent decades, the Entella River basin, in the Liguria Apennines, northern Italy, was hit by numerous intense rainfall events that triggered shallow landslides and earth flows, causing casualties and extensive damage. We analyzed landslide information obtained from different sources and rainfall data recorded in the period 2002-2016 by rain gauges scattered throughout the catchment, to identify the event rainfall duration, D (in h), and rainfall intensity, I (in mmh(-1)), that presumably caused the landslide events. Rainfall-induced landslides affected the whole catchment area, but were most frequent and abundant in the central part, where the three most severe events hit on 23-24 November 2002, 21-22 October 2013 and 10-11 November 2014. Examining the timing and location of the slope failures, we found that the rainfall-induced landslides occurred primarily at the same time or within 6 h from the maximum peak rainfall intensity, and at or near the geographical location where the rainfall intensity was largest. Failures involved mainly forested and natural surfaces, and secondarily cultivated and terraced slopes, with different levels of maintenance. Man-made structures frequently characterize the landslide source areas. Adopting a frequentist approach, we define the event rainfall intensity-event duration (ID) threshold for the possible initiation of shallow landslides and hyper-concentrated flows in the Entella River basin. The threshold is lower than most of the curves proposed in the literature for similar mountain catchments, local areas and single regions in Italy. The result suggests a high susceptibility to rainfall-induced shallow landslides of the Entella catchment due to its high-relief topography, geological and geomorphological settings, meteorological and rainfall conditions, and human interference. Analysis of the antecedent rainfall conditions for different periods, from 3 to 15 days, revealed that the antecedent rainfall did not play a significant role in the initiation of landslides in the Entella catchment. We expect that our findings will be useful in regional to local landslides early warning systems, and for land planning aimed at reducing landslide risk in the study area.
Laura Melelli(1), Massimiliano Alvioli(2), Ivan Marchesini(2), Lorenzo Fongo(1), Michele Santangelo(2), Francesco Bucci(2), Mauro Cardinali(2), 2018, Lithological map of Italy,
2018,
Abstract
This map is the product of the Master degree Thesis of Lorenzo Fongo. The purpose ...
This map is the product of the Master degree Thesis of Lorenzo Fongo. The purpose of the Thesis is to prepare a geo-lithological map of Italy at a scale of 1_100,000, by classifying a comprehensive database of the Istituto Superiore per la Protezione e la Ricerca Ambientale (Institute for Environmental Protection and Research, ISPRA). Data was acquired by an automatic procedure, which allowed us to obtain the full database, containing about 300,000 geo-referenced polygons covering the whole Italian territory. The database includes about 5,500 unique geo-lithological descriptions, on which the work in this Thesis is based. We grouped polygons in three different levels of classification by expert analysis of the unique descriptions, using different criteria. The procedure resulted in a geo-lithological map of the whole Italy at the scale 1_100,000, with a legend including 19 geo-lithological classes. The map, provided in electronic format, is associated with a database, which can be updated and modified to produce different documents, as long as they are based on the underlying geology. The new map can be used for different geomorphological, geo-hydrological and geotechnical purpose, and for the search of raw material resources. The map has limitations and can be enhanced, in particular in local areas in which geo-lithological descriptions in the database were not exhaustive and knowledge was limited.
Candidato: Lorenzo Fongo(1), Relatore: Laura Melelli(1), Corelatori: Massimiliano Alvioli(2), Ivan Marchesini(2), 2018, Verso una nuova carta litologica d’Italia in scala 1_100.000,
2018,
Abstract
L'obiettivo principale del presente lavoro di Tesi è stato la realizzazione di una carta geo-litologica ...
L'obiettivo principale del presente lavoro di Tesi è stato la realizzazione di una carta geo-litologica d'Italia in scala 1_100.000, attraverso la classificazione di un vasto database dell'Istituto Superiore per la Protezione e la Ricerca Ambientale (ISPRA).
I dati sono stati acquisiti attraverso una procedura automatizzata, che ha permesso di ottenere il dato distribuito dall'ISPRA, costituito da circa 300.000 poligoni georeferenziati che ricoprono l'intero territorio Nazionale. Il dato contiene 5.500 descrizioni geo-litologiche univoche, sulle quali è basato tutto il lavoro di Tesi. I poligoni sono stati raggruppati grazie a tre livelli successivi di classificazione tramite un'analisi esperta delle descrizioni univoche, utilizzando diversi criteri.
Il risultato è una carta geo-litologica dell'intero territorio Italiano in scala 1_100.000 e comprende una legenda unica con diciannove classi geo-litologiche. La carta in formato elettronico è associata ad una banca dati aggiornabile, e quindi modificabile in documenti differenti purché coerenti con la copertura geologica.
Questa mappa ha notevoli potenzialità, può essere utilizzata per numerose applicazioni a livello_ geomorfologico, idrogeologico, geotecnico e per la ricerca di materie prime.
La carta finale ha dei limiti, può e deve essere migliorata, soprattutto localmente in zone in cui la conoscenza e le descrizioni geo-litologiche del database risultato scarse.
Alvioli, M., Marchesini, I., Reichenbach, P., Rossi, M., Fiorucci, F., 2018, Unità territoriali di riferimento,
P-05-1, 2018,
Abstract
Il documento illustra la definizione e la delineazione di unità di unità di versante in ...
Il documento illustra la definizione e la delineazione di unità di unità di versante in Italia,
da utilizzare per la zonazione di suscettibilità di frane superficiali e profonde. I risultati
riportati rientrano nell'attività di ricerca prevista dall'Allegato Tecnico al Contratto fra
Rete Ferroviaria Italiana S.p.A. e l'Istituto di Ricerca per la Protezione Idrogeologica,
del Consiglio Nazionale delle Ricerche, Centro di Competenza sul tema del dissesto
idrogeologico per la rete nazionale dei centri funzionali di protezione
civile.
M. Alvioli, I. Marchesini, F. Guzzetti, 2018, Nation-wide, general-purpose delineation of geomorphological slope units in Italy,
Geomorphometry 2018, pp. 1–4, Boulder CO, USA, 13/08/2018, 17/08/2018,
Abstract
Slope units are portions of terrain, defined by the general requirement of maximizing homogeneity within ...
Slope units are portions of terrain, defined by the general requirement of maximizing homogeneity within a single unit and heterogeneity between different ones. Slope units are being used to describe a variety of processes and to assess different natural hazards. An unambiguous and reproducible definition of slope units based on quantitative hydrologic and topographic criteria was previously provided by the r.slopeunits software to automatically draw slope unit polygons on a digital surface. The software contains an adaptive algorithm allowing for a flexible yet well-defined slope unit delineation, by means of an iterative procedure. It requires a digital elevation model and a few input parameters, whose values must be optimized in a sound way, by means of multiple software runs and a proper objective function. The code is designed to quickly produce results on large areas, and in this work we devised an optimization algorithm to delineate slope units over the whole Italian peninsula. We outline the rationale of the optimization procedure for a general purpose slope unit delineation within very large areas. We present preliminary results in Central Italy, specifically a slope unit mosaic in the whole area affected by the 2016 earthquake sequence. The procedure represents a well-defined framework for slope unit delineation over the whole of Italy.
M. Alvioli, A. C. Mondini, F. Fiorucci, M. Cardinali, I. Marchesini, 2018, Automatic landslide mapping from satellite imagery with a topography-driven thresholding algorithm,
Geomorphometry 2018, pp. 1–4, Boulder CO, USA, 13/08/2018, 17/08/2018,
Abstract
We present an improvement of image classification by "thresholding", using topographic information to determine multiple ...
We present an improvement of image classification by "thresholding", using topographic information to determine multiple thresholds. We devised a two-steps procedure for automatic classification into landslide or no landslide categories of a change-detection map obtained from satellite imagery. Requirements of the proposed procedure are knowledge of the occurrence of a landslide event, availability of a pre- and postevent pseudo-stereo image pair and a digital elevation model. The novel feature of the approach is represented by the use of slope units as topographic-aware subsets of the scene within which we apply a multiple thresholding method to classify a landslide class membership tuned on the sole landslide spectral response. The method is fully automatic after site-dependent operations, required only once, are performed, and exhibits improved classification performance with limited training requirements. Our automatic procedure is a step forward towards systematic acquisition of landslide events and real-time landslide mapping from satellite imagery.
Giordan Daniele, Cignetti Martina, Godone Danilo, Notti Davide, Allasia Paolo, Cardinali Mauro, Fiorucci Federica, Santangelo Michele, Bucci Francesco, 2018, Sopralluogo in aree frana_ Sopralluoghi sul terreno (Val d’Agri) e analisi multi-temporale foto aeree – Monografia operativa AGRI 1 V.3,
2018,
Abstract
Report tecnico per l'analisi dell'interazione tra i fenomeni franosi e le strutture di estrazione e ...
Report tecnico per l'analisi dell'interazione tra i fenomeni franosi e le strutture di estrazione e trasferimento degli idrocarburi della concessione petrolifera in Val d'Agri, Basilicata
Francesco Mirabella, Francesco Bucci, Michele Santangelo, Mauro Cardinali,
Grazia Caielli, Roberto De Franco, Fausto Guzzetti & Massimiliano R. Barchi, 2018, Alluvial fan shifts and stream captures driven by extensional tectonics in central Italy,
Journal of the Geological Society (Lond.) (2018). doi_10.1144/jgs2017-138,
DOI: 10.1144%2Fjgs2017-138
Abstract
Subsidence over the last 0.78 myr of a basin in central Italy bounded by a ...
Subsidence over the last 0.78 myr of a basin in central Italy bounded by a normal fault caused the deactivation and uplift of an Early-Middle Pleistocene alluvial fan at the fault footwall. Uplift of the fan occurred with a basin-bounding fault slip-rate of the order of 0.2 mm a-1. Subsidence resulted in the reorganization of the river network due to a fall in base level, which triggered headward erosion, stream piracy effects and drainage inversion. The mapped river inversions and catchment piracy were related to the distribution of a quantile regression of 134 alluvial fans v. basin areas. Despite the fact that the two parameters werewell fitted by a power law relationship, all the fans corresponding to the captured rivers lay above the regression line (in the fan area field), whereas those corresponding to the capturing rivers were below the regression line (in the basin area field). We propose a general model of alluvial fan growth in active extensional settings that helps to interpret this scatter of fan v. basin area distribution and to identify the most active fault segments. Such an approach can better constrain fault activity in a time window that bridges long-term deformation and the present day deformation inferred from geodesy and/or seismology, increasing our understanding of the steadiness/unsteadiness behaviour of faults.
Silvia Peruccacci, Maria Teresa Brunetti, Stefano Luigi Gariano, Massimo Melillo, Mauro Rossi, Fausto Guzzetti, 2018, Rainfall thresholds for the possible initiation of landslides in different environmental settings in Italy,
European Geosciences Union General Assembly 2018, pp. EGU2018-7696–EGU2018-7696, Vienna, 08-13/04/2018,
Abstract
The large physiographic variability and the abundance of landslide and rainfall data make Italy an ...
The large physiographic variability and the abundance of landslide and rainfall data make Italy an ideal site to investigate variations in the rainfall conditions that can trigger rainfall-induced landslides. To build a catalogue of 2309 rainfall events with - mostly shallow - landslides in Italy between January 1996 and February 2014, we used accurate landslide information and rainfall data captured by 2228 rain gauges. For each rainfall event with landslides, we reconstructed the rainfall presumably responsible for the failure, in terms of rainfall duration D (in hours) and cumulated event rainfall E (in mm). Adopting a power-law threshold model, we calculated objective and reproducible ED thresholds. We defined a national threshold for Italy, and 26 regional thresholds for environmental subdivisions based on topography, lithology, land-use, land cover, climate, and meteorology. We used the thresholds to assess the rainfall conditions that can result in landslides in different environmental settings in Italy.
We found that the national and the environmental thresholds are similar, and cover a small part of the possible DE domain. The finding encourages the use of empirical rainfall thresholds for landslide forecasting in Italy, but poses an empirical limitation to the possibility of defining accurate thresholds for small geographical areas. We observed differences between some of the thresholds. With increasing mean annual precipitation (MAP), the thresholds become higher and steeper, indicating that more rainfall is needed to trigger landslides where the MAP is higher. We also observed that the thresholds become higher for stronger rocks, and that forests exhibit a higher threshold than agricultural areas. We maintain that our findings foster the understanding of the rainfall conditions responsible for landslides, and we expect that our results will have an impact on the definition of new rainfall thresholds for possible landslide occurrence in Italy, and elsewhere
Tauro, Flavia; Selker, John; van de Giesen, Nick; Abrate, Tommaso; Uijlenhoet, Remko; Porfiri, Maurizio; Manfreda, Salvatore; Caylor, Kelly; Moramarco, Tommaso; Benveniste, Jerome; Ciraolo, Giuseppe; Estes, Lyndon; Domeneghetti, Alessio; Perks, Matthew T.; Corbari, Chiara; Rabiei, Ehsan; Ravazzani, Giovanni; Bogena, Heye; Harfouche, Antoine; Brocca, Luca; Maltese, Antonino; Wickert, Andy; Tarpanelli, Angelica; Good, Stephen; Alcala, Jose Manuel Lopez; Petroselli, Andrea; Cudennec, Christophe; Blume, Theresa; Hut, Rolf; Grimaldi, Salvatore, 2018, Measurements and Observations in the XXI century (MOXXI): innovation and multi-disciplinarity to sense the hydrological cycle,
Hydrological sciences journal 63 (2018): 169–196. doi_10.1080/02626667.2017.1420191,
DOI: 10.1080%2F02626667.2017.1420191
Abstract
To promote the advancement of novel observation techniques that may lead to new sources of ...
To promote the advancement of novel observation techniques that may lead to new sources of information to help better understand the hydrological cycle, the International Association of Hydrological Sciences (IAHS) established the Measurements and Observations in the XXI century (MOXXI) Working Group in July 2013. The group comprises a growing community of tech-enthusiastic hydrologists that design and develop their own sensing systems, adopt a multi-disciplinary perspective in tackling complex observations, often use low-cost equipment intended for other applications to build innovative sensors, or perform opportunistic measurements. This paper states the objectives of the group and reviews major advances carried out by MOXXI members toward the advancement of hydrological sciences. Challenges and opportunities are outlined to provide strategic guidance for advancement of measurement, and thus discovery.
Nasta, Paolo; Penna, Daniele; Brocca, Luca; Zuecco, Giulia; Romano, Nunzio, 2018, Downscaling near-surface soil moisture from field to plot scale_ A comparative analysis under different environmental conditions,
Journal of hydrology (Amst.) 557 (2018): 97–108. doi_10.1016/j.jhydrol.2017.12.017,
DOI: 10.1016%2Fj.jhydrol.2017.12.017
Abstract
Indirect measurements of field-scale (hectometer grid-size) spatial-average near-surface soil moisture are becoming increasingly available by ...
Indirect measurements of field-scale (hectometer grid-size) spatial-average near-surface soil moisture are becoming increasingly available by exploiting new-generation ground-based and satellite sensors. Nonetheless, modeling applications for water resources management require knowledge of plot-scale (1-5 m grid-size) soil moisture by using measurements through spatially-distributed sensor network systems. Since efforts to fulfill such requirements are not always possible due to time and budget constraints, alternative approaches are desirable. In this study, we explore the feasibility of determining spatial-average soil moisture and soil moisture patterns given the knowledge of long-term records of climate forcing data and topographic attributes. A downscaling approach is proposed that couples two different models_ the Eco-Hydrological Bucket and Equilibrium Moisture from Topography. This approach helps identify the relative importance of two compound topographic indexes in explaining the spatial variation of soil moisture patterns, indicating valley- and hillslope-dependence controlled by lateral flow and radiative processes, respectively. The integrated model also detects temporal instability if the dominant type of topographic dependence changes with spatial-average soil moisture. Model application was carried out at three sites in different parts of Italy, each characterized by different environmental conditions. Prior calibration was performed by using sparse and sporadic soil moisture values measured by portable time domain reflectometry devices. Cross-site comparisons offer different interpretations in the explained spatial variation of soil moisture patterns, with time-invariant valley-dependence (site in northern Italy) and hillslope-dependence (site in southern Italy). The sources of soil moisture spatial variation at the site in central Italy are time-variant within the year and the seasonal change of topographic dependence can be conveniently correlated to a climate indicator such as the aridity index. (C) 2017 Elsevier B.V. All rights reserved.
Chiaravalloti, Francesco; Brocca, Luca; Procopio, Antonio; Massari, Christian; Gabriele, Salvatore, 2018, Assessment of GPM and SM2RAIN-ASCAT rainfall products over complex terrain in southern Italy,
Atmospheric research (Print) 206 (2018): 64–74. doi_10.1016/j.atmosres.2018.02.019,
DOI: 10.1016%2Fj.atmosres.2018.02.019
Abstract
The assessment of precipitation over land is extremely important for a number of scientific purposes ...
The assessment of precipitation over land is extremely important for a number of scientific purposes related to the mitigation of natural hazards, climate modelling and prediction, famine and disease monitoring, to cite a few. Due to the difficulties and the cost to maintain ground monitoring networks, i.e., raingauges and meteorological radars, remote sensing is receiving more and more attention in the recent decade(s). However, the accuracy of satellite observations of rainfall should be assessed with ground information as it is affected by a number of factors (topography, vegetation density, land-sea interface). Calabria is a peninsular region in southern Italy characterized by complex topography, dense vegetation and a narrow North-South elongated shape, thus being a very challenging place for rainfall retrieval from remote sensing. In this study, we built a high-quality rainfall datasets from raingauges and meteorological radars for testing three remotely sensed rainfall products_ 1) the Integrated Multi-satellitE Retrievals for Global Precipitation Measurement product (IMERG), 2) the SM2RASC product obtained from the application of SM2RAIN (Soil Moisture TO RAIN) algorithm to the Advanced SCATterometer (ASCAT) derived satellite soil moisture data, and 3) a product derived from a simple combination of IMERG and SM2RASC. The assessment of the products is carried out at different rainfall time accumulation (e.g., from 0.5 to 24 h) for a ~2-year period from 10th March 2015, to 31st December 2016. Results show that IMERG has good performance at time resolutions higher than 6 h. At daily time scale, IMERG and SM2RASC show similar results with median correlations, R, ~0.60, and root mean square error, RMSE, ~7.6 mm/day (BIAS is -0.85 and +0.51 mm/day, respectively). The combined product outperforms the parent products (median R > 0.70, RMSE<6.5 mm/day, BIAS -0.07 mm/day). Among the different factors affecting products quality, topographic complexity seems to play the more relevant role, particularly for SM2RASC but also for IMERG. Overall, this study shows that the investigated satellite-based products agree reasonably well with observations notwithstanding the challenging features of the region, and the combination of IMERG and SM2RASC provides a way to overcome their limitations and to produce a higher quality satellite rainfall product.
Ciabatta L.; Massari C.; Brocca L.; Gruber A.; Reimer C.; Hahn S.; Paulik C.; Dorigo W.; Kidd R.; Wagner W., 2018, SM2RAIN-CCI: A new global long-term rainfall data set derived from ESA CCI soil moisture,
Earth system science data (Print) 10 (2018): 267–280. doi_10.5194/essd-10-267-2018,
DOI: 10.5194%2Fessd-10-267-2018
Abstract
Accurate and long-term rainfall estimates are the main inputs for several applications, from crop modeling ...
Accurate and long-term rainfall estimates are the main inputs for several applications, from crop modeling to climate analysis. In this study, we present a new rainfall data set (SM2RAIN-CCI) obtained from the inversion of the satellite soil moisture (SM) observations derived from the ESA Climate Change Initiative (CCI) via SM2RAIN (Brocca et al., 2014). Daily rainfall estimates are generated for an 18-year long period (1998-2015), with a spatial sampling of 0.25° on a global scale, and are based on the integration of the ACTIVE and the PASSIVE ESA CCI SM data sets.The quality of the SM2RAIN-CCI rainfall data set is evaluated by comparing it with two state-of-the-art rainfall satellite products, i.e. the Tropical Measurement Mission Multi-satellite Precipitation Analysis 3B42 real-time product (TMPA 3B42RT) and the Climate Prediction Center Morphing Technique (CMORPH), and one modeled data set (ERA-Interim). A quality check is carried out on a global scale at 1° of spatial sampling and 5 days of temporal sampling by comparing these products with the gauge-based Global Precipitation Climatology Centre Full Data Daily (GPCC-FDD) product. SM2RAIN-CCI shows relatively good results in terms of correlation coefficient (median value > 0.56), root mean square difference (RMSD, median value < 10.34mm over 5 days) and bias (median value < 14.44%) during the evaluation period. The validation has been carried out at original resolution (0.25°) over Europe, Australia and five other areas worldwide to test the capabilities of the data set to correctly identify rainfall events under different climate and precipitation regimes.The SM2RAIN-CCI rainfall data set is freely available at
https://doi.org/10.5281/zenodo.846259.
Jalal Samia (1,4), Arnaud Temme (2,5), Arnold K. Bregt (1), Jakob Wallinga (4), John Stuiver (1), Fausto Guzzetti (3), Francesca Ardizzone (3), Mauro Rossi (3), 2018, Implementing landslide path dependency, in landslide susceptibility modelling,
Landslides (Berl., Internet) (2018). doi_10.1007/s10346-018-1024-y,
DOI: 10.1007%2Fs10346-018-1024-y
Abstract
Landslide susceptibility modelling--a crucial step towards the assessment of landslide hazard and risk--has hitherto not ...
Landslide susceptibility modelling--a crucial step towards the assessment of landslide hazard and risk--has hitherto not included the local, transient effects of previous landslides on susceptibility. In this contribution, we implement such transient effects, which we term Blandslide path dependency^, for the first time. Two landslide path dependency variables are used to characterise transient effects_ a variable reflecting how likely it is that an earlier landslide will have a follow-up landslide and a variable reflecting the decay of transient effects over time. These two landslide path dependency variables are considered in addition to a large set of conditioning attributes conventionally used in landslide susceptibility. Three logistic regression models were trained and tested fitted to landslide occurrence data from a multi-temporal landslide inventory_ (1) a model with only conventional variables, (2) a model with conventional plus landslide path dependency variables, and (3) a model with only landslide path dependency variables. We compare the model performances, differences in the number, coefficient and significance of the selected variables, and the differences in the resulting susceptibility maps. Although the landslide path dependency variables are highly significant and have impacts on the importance of other variables, the performance of the models and the susceptibility maps do not substantially differ between conventional and conventional plus path dependent models. The path dependent landslide susceptibility model, with only two explanatory variables, has lower model performance, and differently patterned susceptibility map than the two other models. A simple landslide susceptibility model using only DEM-derived variables and landslide path dependency variables performs better than the path dependent landslide susceptibility model, and almost as well as the model with conventional plus landslide path dependency variables--while avoiding the need for hard-to-measure variables such as land use or lithology. Although the predictive power of landslide path dependency variables is lower than those of the most important conventional variables, our findings provide a clear incentive to further explore landslide path dependency effects and their potential role in landslide susceptibility modelling.
T. Bornaetxea(1), M. Rossi(2), I. Marchesini(2), M. Alvioli(2), 2018, Effective surveyed area and its role in statistical landslide susceptibility assessments,
Natural hazards and earth system sciences (Online) 18 (2018): 2455–2469. doi_10.5194/nhess-18-2455-2018,
DOI: 10.5194%2Fnhess-18-2455-2018
Abstract
Geomorphological field mapping is a conventional method to prepare landslide inventories. The approach is typically ...
Geomorphological field mapping is a conventional method to prepare landslide inventories. The approach is typically hampered by the accessibility and visibility, during field campaigns for landslide mapping, of the different portions of the study area. Statistical significance of landlside susceptibility maps can be significantly reduced if the classification algorithm is trained in unsurveyed regions of the study area, for which landslide absence is tipically assumed, while ingnorance about landslide presence should actually be aknowledged. We compare different landslide susceptibility zonations obtained by training the classification model either in the entire study area or in the only portion of the area that was actually surveyed, which we name effective surveyed area. The latter was delineated by an automatic procedure specifically devised for the purpose, which uses information gathered during surveys, along with landslide locations. The method was tested in Gipuzkoa Province (Basque Country), North of the Iberian Peninsula, where digital thematic maps were available and a landslide survey was performed. We prepared the landslide susceptibility maps and the associated uncertainty within a logistic regression model, using both slope units and regular grid cells as reference mapping unit. Results indicate that the use of effective surveyed area for landslide susceptibility zonation is a valid approach to minimize the limitations stemming from unsurveyed regions at landslide mapping time. Use of slope units as mapping units, instead of grid cells, mitigates the uncertainties introduced by training the automatic classifier within the entire study area. Our method pertains to data preparation and, as such, the relevance of our conclusions is not limited to the logistic regression but are valid for virtually all the existing multivariate landslide susceptibility models.
M. Alvioli, A. C. Mondini, F. Fiorucci, M. Cardinali, I. Marchesini, 2018, Topography-driven satellite imagery analysis for landslide mapping,
Geomatics, natural hazards & risk (Print) 9 (2018): 544–567. doi_10.1080/19475705.2018.1458050,
DOI: 10.1080%2F19475705.2018.1458050
Abstract
We describe a semi-automatic procedure for the classification of satellite imagery into landslide or no ...
We describe a semi-automatic procedure for the classification of satellite imagery into landslide or no landslide categories, aimed at preparing event landslide inventory maps. The two-steps procedure requires knowledge of the occurrence of a landslide event, availability of a pre- and post- event pseudo-stereo pair and a digital elevation model. The first step consists in the evaluation of a discriminant function, applied to a combination of well-known change detection indices tuned on landslide spectral response. The second step is devoted to discriminant function classification, aimed at distinguishing the only landslide class, through an improvement of the usual 'thresholding' method. We devised a multi-threshold classification, in which thresholding is applied separately in small subsets of the scene. We show that using slope units as topographic-aware subsets produces best classification performance when compared to the ground truth of a landslide inventory prepared by visual interpretation. The method proved to be superior to the use of a single threshold and to any multi-threshold procedure based on topography-blind subdivisions of the scene, especially in the validation stage. We argue that the improved classification performance and limited training requirements represent a step forward towards an automatic, real-time landslide mapping from satellite imagery.
Stefano Luigi Gariano (1), Luca Piciullo (2), and Samuele Segoni (3), 2018, Latest progresses in rainfall thresholds, a fundamental component for regional landslide early warning systems,
European Geosciences Union General Assembly 2018, pp. EGU2018-8432–EGU2018-8432, Vienna, 08-13/04/2018,
Abstract
The calculation of reliable, objective, reproducible, and effective rainfall thresholds for landslide forecasting is a ...
The calculation of reliable, objective, reproducible, and effective rainfall thresholds for landslide forecasting is a fundamental component in the definition of a regional landslide early warning system. The process regarding the definition of rainfall thresholds was deeply investigated, producing numerous case studies at different scales and several important technical and scientific advances. Rainfall thresholds were broadly used considering_ different scale of analysis, a wide variety of rainfall parameters, various physiographic settings, and different landslide types.
In the recent years, several methods were proposed to define thresholds and to implement them into landslide early warning systems. Therefore, we found necessary to review the recent international literature (papers published in international peer-reviewed scientific journals), gathering information about the definition, the employment and the validation of landslide rainfall thresholds worldwide. We collected and grouped all the information on rainfall threshold for landslide occurrence according to four categories_ publication details, geographical distribution and
uses, dataset features, thresholds definition. In each category, we selected descriptive information to characterize thoroughly each one of the 115 rainfall thresholds published in the 9-year period 2008-2016. We highlighted the most significant advances, the best practices, the main drawbacks still affecting recent case studies (e.g., lack of objective and reproducible methods for calibrating and validating the thresholds), the most common critical problems and the most effective solutions adopted.
With this work, we aim at describing the main characteristics of the reviewed thresholds and to produce a complete framework of new procedures to be used as guideline for future studies and applications by scientists and stakeholders involved in landslide hazard management and early warning.
M.T. Brunetti (a)
M. Melillo (a)
S. Peruccacci (a)
L. Ciabatta (a,b)
L. Brocca (a), 2018, How far are we from the use of satellite rainfall products in landslide forecasting?,
Remote sensing of environment 210 (2018): 65–75. doi_10.1016/j.rse.2018.03.016,
DOI: 10.1016%2Fj.rse.2018.03.016
Abstract
Satellite rainfall products have been available for many years (since '90) with an increasing spatial/temporal
resolution ...
Satellite rainfall products have been available for many years (since '90) with an increasing spatial/temporal
resolution and accuracy. Their global scale coverage and near real-time products perfectly fit the need of an early
warning landslide system. Notwithstanding these characteristics, the number of studies employing satellite
rainfall estimates for predicting landslide events is quite limited.
In this study, we propose a procedure that allows us to evaluate the capability of different rainfall products to
forecast the spatial-temporal occurrence of rainfall-induced landslides using rainfall thresholds. Specifically, the
assessment is carried out in terms of skill scores, and receiver operating characteristic (ROC) analysis. The
procedure is applied to ground observations and four different satellite rainfall estimates_ 1) the Tropical Rainfall
Measurement Mission Multi-satellite Precipitation Analysis, TMPA, real time product (3B42-RT), 2) the
SM2RASC product obtained from the application of SM2RAIN algorithm to the Advanced SCATterometer
(ASCAT) derived satellite soil moisture (SM) data, 3) the Precipitation Estimation from Remotely Sensed
Information using Artificial Neural Network (PERSIANN), and 4) the Climate Prediction Center (CPC) Morphing
Technique (CMORPH). As case study, we consider the Italian territory for which a catalogue listing 1414 rainfallinduced
landslides in the period 2008-2014 is available.
Results show that satellite products underestimate rainfall with respect to ground observations. However, by
adjusting the rainfall thresholds, satellite products are able to identify landslide occurrence, even though with
less accuracy than ground-based rainfall observations. Among the four satellite rainfall products, CMORPH and
SM2RASC are performing the best, even though differences are small. This result is to be attributed to the high
spatial/temporal resolution of CMORPH, and the good accuracy of SM2RSC. Overall, we believe that satellite
rainfall estimates might be an important additional data source for developing continental or global landslide
warning systems.
M. Alvioli(1), M. Melillo(1), F. Guzzetti(1), M. Rossi(1), E. Palazzi(2), J. von Hardenberg(2), M. T. Brunetti(1), S. Peruccacci(1), 2018, Implications of climate change on landslide hazard in Central Italy,
Science of the total environment 630 (2018): 1528–1543. doi_10.1016/j.scitotenv.2018.02.3151528-1543,
DOI: 10.1016%2Fj.scitotenv.2018.02.3151528-1543
Abstract
The relation between climate change and its potential effects on the stability of slopes remains ...
The relation between climate change and its potential effects on the stability of slopes remains an open issue. For rainfall induced landslides, the point consists in determining the effects of the projected changes in the duration and amounts of rainfall that can initiate slope failures. We investigated the relationship between fine-scale climate projections obtained by downscaling and the expected modifications in landslide occurrence in Central Italy. We used rainfall measurements taken by 56 rain gauges in the 9-year period 2003 - 2011, and the RainFARM technique to generate downscaled synthetic rainfall fields from global climate model projections for the 14-year calibration period 2002-2015, and for the 40-year projection period 2010-2049. Using a specific algorithm, we extracted a number of rainfall events, i.e. rainfall periods separated by dry periods of no or negligible amount of rain, from the measured and the synthetic rainfall series. Then, we used the selected rainfall events to force TRIGRS v. 2.1, the Transient Rainfall Infiltration and Grid-Based Regional Slope-Stability Model. We analyzed the results in terms of variations (or lack of variations) in the pluviometric thresholds for the possible initiation of landslides, in the probability distribution of landslide size (area), and in landslide hazard. Results showed that the downscaled rainfall fields obtained by RainFARM can be used to single out rainfall events, and to force the slope stability model. Results further showed that while the rainfall thresholds for landslide occurrence are expected to change in future scenarios, the probability distribution of landslide areas are not. We infer that landslide hazard in the study area is expected to change in response to the projected variations in the rainfall conditions. We expect that our results will contribute to regional investigations of the expected impact of projected climate variations on slope stability conditions and on landslide hazards.
Silvia Peruccacci and Maria Teresa Brunetti, 2018, TXT-tool 4.039-1.1 Definition and Use of Empirical Rainfall Thresholds for Possible Landslide Occurrence,
Volume 2_ Testing, Risk Management and Country Practices, pp. 607–619, 2018,
Abstract
In Italy, landslides are frequent and widespread phenomena triggered chiefly by intense or prolonged rainfall. ...
In Italy, landslides are frequent and widespread phenomena triggered chiefly by intense or prolonged rainfall. Individual rainfall events can result in single or multiple slope failures in small areas or in very large regions, causing fatalities and large economic damage. Thus, assessing the rainfall conditions responsible for landslides is important and may contribute to reducing risk. Following a review of methods for establishing the dependence of landslide occurrence on rainfall. Next, we present the statistical method used for the definition of objective cumulated event rainfall-duration (ED) thresholds, and we show regional, lithological and seasonal thresholds in central Italy.
Silvia Peruccacci, Maria Teresa Brunetti and Fausto Guzzetti, 2018, TXT-tool 2.039-1.3 Topographic and Pedological Rainfall Thresholds for the Prediction of Shallow Landslides in Central Italy,
Volume 1_ Fundamentals, Mapping and Monitoring, pp. 371–380, 2018,
Abstract
In Italy, rainfall-induced shallow landslides are frequent phenomena that cause casualties, damages and economic losses ...
In Italy, rainfall-induced shallow landslides are frequent phenomena that cause casualties, damages and economic losses every year. At the national and regional scales, empirical rainfall thresholds can predict the occurrence of multiple rainfall-induced shallow landslides. In this work, we updated an historical catalogue listing 553 rainfall events that triggered 723 landslides in the Abruzzo, Marche and Umbria regions, central Italy, between February 2002 and March 2011. For each event, the rainfall duration (D) and the cumulated event rainfall (E) responsible for the failure are known, together with the exact or approximate location of the landslide. Landslides were mapped as single points and were attributed a level of mapping accuracy P, in 3 classes. To analyse the influence of topography and soil characteristics on the occurrence of rainfall-induced shallow landslides, we subdivided the study area in three topographic divisions, and eight soil domains. We analysed the (D, E) rainfall conditions that resulted in the documented shallow landslides in each topographic division and regional soil domain, and we computed ED rainfall thresholds at 5% exceedance probability level for the two subdivisions. We expect that the new topographic and pedological thresholds will contribute to forecast shallow landslides in central Italy, and in areas characterized by similar morphological and soil settings.
1 Maria Teresa Brunetti, 1 Silvia Peruccacci,
2 Michela Rosa Palladino, 3 Alessia Viero, 1 Fausto Guzzetti, 2018, TXT-tool 2.039-1.2 Rainfall Thresholds for the Possible Initiation of Landslides in the Italian Alps,
Fundamentals, Mapping and Monitoring, pp. 361–369, 2018,
Abstract
Rainfall-induced landslides are frequent in the Italian Alps, where they cause severe economic damages and ...
Rainfall-induced landslides are frequent in the Italian Alps, where they cause severe economic damages and loss of life. The prediction of rainfall-induced slope failures is of utmost importance for civil protection purposes and relies upon the definition of physically based or empirical rainfall thresholds. Reliable empirical rainfall thresholds require a large amount of information on the geographical and temporal location of rainfall events that caused past mass movements. We have compiled a catalogue listing 453 rainfall events that have triggered 509 landslides in the Italian Alps in the 13-year period 2000-2012. For the purpose, we searched national and local newspapers, blogs, technical reports, historical databases, and scientific journals. In the catalogue, for each rainfall event that triggered one or more failures, the information includes_ (i) landslide geographical position, (ii) date of the landslide occurrence, (iii) landslide type (if available from the source of information), and (iv) rainfall information. Using the available information, we calculated the cumulated amount (E) and the duration (D) of the rainfall that likely caused the documented slope failures. We exploited the catalogue to calculate new ED threshold curves and their associated uncertainties for the Italian Alps adopting a frequentist approach. To define seasonal rainfall thresholds, we also investigated the monthly distribution of the landslides. The new thresholds are compared with similar curves in the same general area. We expect the results of our study to improve the ability to forecast landslides in the Italian Alps and, more generally, in the wider Alpine region.
Massimo Melillo, Maria Teresa Brunetti, Silvia Peruccacci, Stefano Luigi Gariano and Fausto Guzzetti, 2018, TXT-tool 2.039-1.5 An Algorithm for the Objective Reconstruction of Rainfall Events Responsible for Landslides,
Fundamentals, Mapping and Monitoring, edited by Kyoji Sassa, Fausto Guzzetti, Hiromitsu Yamagishi, ?eljko Arbanas, Nicola Casagli, Mauri McSaveney, Khang Dang, pp. 433–447. Kyoto_ Kyoji Sassa editor, 2018,
Abstract
The primary trigger of damaging landslides in Italy is intense or prolonged rainfall. Definition of ...
The primary trigger of damaging landslides in Italy is intense or prolonged rainfall. Definition of the rainfall conditions responsible for landslides is a crucial issue and may contribute to reducing landslide risk. Criteria for identifying the rainfall conditions that could initiate slope failures are still lacking or uncertain. Expert investigators usually reconstruct rainfall events manually. In this paper, we propose an algorithm for the objective and reproducible definition of rainfall conditions responsible for landslides, from a series of hourly rainfall data. The algorithm, which is implemented in R (http://www.r-project.org), performs a series of actions_ (i) removes isolated events with negligible amount of rainfall and random noise generated by the rain gauge; (ii) aggregates rainfall measurements in order to obtain a sequence of distinct rainfall events; (iii) identifies single or multiple rainfall conditions responsible for the slope failures. The result is the objective reconstruction of the duration, D, and the cumulated rainfall, E, for rainfall events, and for rainfall conditions that have resulted in landslides. We tested the algorithm using rainfall and landslide information for the period between January 2002 and December 2012 in Sicily, Southern Italy. The algorithm reconstructed 13,537 rainfall events and 343 rainfall conditions as possible triggers using the information on 163 documented landslides. The comparison between automatic and manually method highlights that most (87.7%) of the rainfall conditions obtained manually were reconstructed accurately. Use of the algorithm is the objective reconstruction of the duration, D, and the cumulated rainfall, E, for rainfall events, and for rainfall conditions that have resulted in landslides. We tested the algorithm using rainfall and landslide should contribute to reducing the current subjectivity inherent in the
manual treatment of the rainfall and landslide data.
Kyoji SassaFausto GuzzettiHiromitsu Yamagishi?eljko ArbanasNicola CasagliMauri McSaveneyKhang Dang, 2018, Landslide Dynamics_ ISDR-ICL Landslide Interactive Teaching Tools,
Berlin: Springer International Publishing AG, 2018,
Abstract
This interactive book presents comprehensive information on the fundamentals of landslide types and dynamics, while ...
This interactive book presents comprehensive information on the fundamentals of landslide types and dynamics, while also providing a set of PPT, PDF, and text tools for education and capacity development. As the core activity of the Sendai Partnerships, the International Consortium of Landslides has created this two-volume work, which will be regularly updated and improved over the coming years, based on responses from users and lessons learned during its application.
Ivan Marchesini, Massimiliano Alvioli, Mauro Rossi, 2018, TXT-tool 3.039-1.1 Landslide-Related WPS Services,
Testing, Risk Management and Country Practices, edited by Sassa, Kyoji; Tiwari, Binod; Liu, Ko-Fei; McSaveney, Mauri; Strom, Alexander; Setiawan, Hendy, pp. 435–443. Kyoto_ Kyoji Sassa editor, 2018,
Abstract
Researchers have developed and implemented software tools for a number of geospatial algorithms to support ...
Researchers have developed and implemented software tools for a number of geospatial algorithms to support the analysis of the slope movements at different spatial scales. Frequently, these tools are implemented using Open Source software and are based on specific combinations of software libraries, programming languages and operating systems. This often limits the portability of these tools and hampers their sharing with a large community of potential users. To overcome these limitations, some researchers have started to make available their software tools through the Web Processing Service standard. This work introduces the reader to the WPS usage and explains how to take advantage of some existing WPS processes dealing with landslide size probability, bedding attitude estimation, morpho-structural domain definition, slope-units delineation.
Ardizzone F., Fiorucci F., Mondini A.C., Guzzetti F., 2018, TXT-tool 1.039-1.1: Very-High Resolution Stereo Satellite Images for Landslide Mapping,
, pp. 83–94, 2018,
Abstract
Il capitolo rappresenta un "teaching tool" , uno strumento educativo volto ad insegnare un metodo ...
Il capitolo rappresenta un "teaching tool" , uno strumento educativo volto ad insegnare un metodo di mappatura delle frane utilizzando immagini satellitari stereoscopiche ad alta risoluzione.
Olga Petrucci, Paola Salvati, Luigi Aceto, Cinzia Bianchi, Angela Aurora Pasqua,
Mauro Rossi and Fausto Guzzetti, 2018, The Vulnerability of People to Damaging Hydrogeological Events in the Calabria Region (Southern Italy).,
International journal of environmental research and public health (Online) 15 (2018). doi_10.3390/ijerph15010048,
DOI: 10.3390%2Fijerph15010048
Abstract
Abstract: Background_ Damaging Hydrogeological Events (DHEs) are severe weather periods during
which floods, landslides, lightning, windstorms, ...
Abstract: Background_ Damaging Hydrogeological Events (DHEs) are severe weather periods during
which floods, landslides, lightning, windstorms, hail or storm surges can harm people. Climate
change is expected to increase the frequency/intensity of DHEs and, consequently, the potential harm
to people. Method_ We investigated the impacts of DHEs on people in Calabria (Italy) over 37 years
(1980-2016). Data on 7288 people physically affected by DHEs were gathered from the systematic
analysis of regional newspapers and collected in the database named PEOPLE. The damage was
codified in three severity levels as follows_ fatalities (people who were killed), injured (people who
suffered physical harm) and involved (people who were present at the place where an accident
occurred but survived and were not harmed). During the study period, we recorded 68 fatalities,
566 injured and 6654 people involved in the events. Results_ Males were more frequently killed,
injured and involved than females, and females who suffered fatalities were older than males
who suffered fatalities, perhaps indicating that younger females tended to be more cautious than
same-aged males, while older females showed an intrinsic greater vulnerability. Involved people were
younger than injured people and fatalities, suggesting that younger people show greater promptness
in reacting to dangerous situations. Floods caused the majority of the fatalities, injured and involved
people, followed by landslides. Lightning was the most dangerous phenomenon, and it affected a
relatively low number of people, killing 11.63% of them and causing injuries to 37.2%. Fatalities and
injuries mainly occurred outdoors, largely along roads. In contrast, people indoors, essentially in
public or private buildings, were more frequently involved without suffering harm. Being "dragged
by water/mud" and "surrounded by water/mud", respectively, represented the two extremes of
dynamic dangerousness. The dragging effect of rapid-flowing water totally or partially obstructed
the attempts of people to save their lives. In contrast, people surrounded by steady water/mud
encountered difficulties but ultimately could survive. Conclusions_ The study outcomes can be used
in informational campaigns to increase risk awareness among both administrators and citizens and
to improve community resilience, particularly in promoting self-protective behaviors and avoiding
the underestimation of hazardous situations.
Michele Santangelo, Ivan Marchesini, Francesco Mirabella, Francesco Bucci, Mauro Cardinali, Fausto Guzzetti, 2018, From photo-geology to 3D geological models. An open source approach,
4th Open Source Geospatial Research & Education Symposium (OGRS2016), pp. 105–113, Perugia, 12-14/10/2016,
Abstract
Three-dimensional modeling of geological bodies is a useful tool for multiple
applications. Such tasks are usually ...
Three-dimensional modeling of geological bodies is a useful tool for multiple
applications. Such tasks are usually accomplished starting from fieldcollected data, which typically suffer from intrinsic limitations such as
accessibility constraints and punctuality of data collected. In this work, we
explore the reliability of photo-geological mapping from interpretation of
aerial photographs in providing data useful to build up 3D geological models.
The test was conducted in a 15 km2
in Umbria, central Italy. The three-steps
open source GIS procedure that outputs 3D models from photo-geological
data was developed using python in GRASS GIS environment and GNU-Linux
OS. We maintain that this procedure can have potential broad applications in
Earth Sciences, including geological and structural analyses, up to the
preliminary evaluation of potential reservoirs.
Martina Wilde1, Andreas Günther1, Paola Reichenbach2, Jean-Philippe Malet3, Javier Hervás4, 2018, Pan-European Landslide Susceptibility Mapping_ ELSUS Version 2,
Journal of maps (Stud. ed.) 14 (2018). doi_10.1080/17445647.2018.1432511,
DOI: 10.1080%2F17445647.2018.1432511
Abstract
We present an updated version of the European landslide susceptibility map ELSUS 1000 that was ...
We present an updated version of the European landslide susceptibility map ELSUS 1000 that was released through the European Soil Data Centre in 2013. The ELSUS V2 map shows the landslide susceptibility zonation for individual climate-physiographic zones across Europe. ELSUS V2 covers a larger area of Europe than ELSUS 1000 as it includes Iceland, Cyprus, the Faroes, and the Shetlands, at a higher spatial resolution (200 x 200 m). The updated map was prepared using the same semi-quantitative method as for ELSUS 1000, combining landslide frequency ratios information with a spatial multi-criteria evaluation model of three thematic predictors_ slope angle, shallow subsurface lithology and land cover. However, the new map was prepared using also_ i) an extended landslide inventory, containing 30% of additional locations for model calibration, map validation and classification, and ii) a new lithological data set, based on harmonized shallow subsurface information derived from the International Hydrogeological Map of Europe (IHME). The new version of the map increases the overall predictive performance of ELSUS by 8%.
Paola Reichenbach (1), Mauro Rossi (1), Bruce Malamud (2), Monika Mihir (2,3), and Fausto Guzzetti (1), 2018, A review of statistically-based landslide susceptibility models,
Earth-science reviews (2018). doi_10.1016/j.earscirev.2018.03.001,
DOI: 10.1016%2Fj.earscirev.2018.03.001
Abstract
In this paper, we do a critical review of statistical methods for landslide susceptibility assessment ...
In this paper, we do a critical review of statistical methods for landslide susceptibility assessment and associated terrain zonations. Landslide susceptibility is the likelihood of a landslide occurring in an area depending on local terrain conditions, estimating "where" landslides are likely to occur. Since the first attempts to assess landslide susceptibility in the mid-1970s, hundreds of papers have been published using a variety of approaches and methods in different geological and climatic settings. Here, we critically review the statistically-based landslide susceptibility assessment literature by systematically searching for and then compiling an extensive database of 565 peer-review articles from 1983 to 2016. For each article in the literature database, we noted 31 categories/sub-categories of information including study region/extent, landslide type/number, inventory type and period covered, statistical model used, including variable types, model fit/prediction performance evaluation method, and strategy used to assess the model uncertainty. We present graphical visualisations and discussions of commonalities and differences found as a function of region and time, revealing a significant heterogeneity of thematic data types and scales, modelling approaches, and model evaluation criteria. We found that the range of thematic data types used for susceptibility assessment has not changed significantly with time, and that for a number of studies the geomorphological significance of the thematic data used is poorly justified. We also found that the most common statistical methods for landslide susceptibility assessment include logistic regression, neural network analysis, data-overlay, index-based and weight of evidence analyses, with an increasing preference towards machine learning methods in the recent years. Although an increasing number of studies in recent years have assessed the model performance, in terms of model fit and prediction performance, only a handful of studies have evaluated the model uncertainty. Adopting a Susceptibility Quality Level index, we found that the quality of published models has improved over the years, but top-quality assessments remain rare. We identified a clear geographical bias in susceptibility study locations, with many studies in China, India, Italy, South Korea and Turkey, and only a few in Africa, South America and Oceania. Based on previous literature reviews, the analysis of the information collected in the literature database, and our own experience on the subject, we provide recommendations for the preparation, evaluation, and use of landslide susceptibility models and associated terrain zonations.
R. Schlögel(1,2), I. Marchesini (3), M. Alvioli (3), P. Reichenbach (3), M. Rossi (3), J.-P. Malet (2), 2018, Optimizing landslide susceptibility zonation_ Effects of DEM spatial resolution and slope unit delineation on logistic regression models,
Geomorphology (Amst.) 301 (2018): 10–20. doi_10.1016/j.geomorph.2017.10.018,
DOI: 10.1016%2Fj.geomorph.2017.10.018
Abstract
We perform landslide susceptibility zonation with slope units using three digital elevation models (DEMs) of ...
We perform landslide susceptibility zonation with slope units using three digital elevation models (DEMs) of varying spatial resolution of the Ubaye Valley (South French Alps). In so doing, we applied a recently developed algorithm automating slope unit delineation, given a number of parameters, in order to optimize simultaneously the partitioning of the terrain and the performance of a logistic regression susceptibility model. The method allowed us to obtain optimal slope units for each available DEM spatial resolution. For each resolution, we studied the susceptibility model performance by analyzing in detail the relevance of the conditioning variables. The analysis is based on landslide morphology data, considering either the whole landslide or only the source area outline as inputs. The procedure allowed us to select the most useful information, in terms of DEM spatial resolution, thematic variables and landslide inventory, in order to obtain the most reliable slope unit-based landslide susceptibility assessment.
M. Alvioli(1), L. Frankfurt(2,3), D.V. Perepelitsa(4), and M. Strikman(3), 2018, Global analysis of color fluctuation effects in proton- and deuteron-nucleus collisions at RHIC and the LHC,
Physical review. D, Particles, fields, gravitation, and cosmology 98 (2018): 071502-1–071502-6. doi_10.1103/PhysRevD.98.071502,
DOI: 10.1103%2FPhysRevD.98.071502
Abstract
We test the hypothesis that configurations of a proton with a large-x parton, xp?0.1, have ...
We test the hypothesis that configurations of a proton with a large-x parton, xp?0.1, have a smaller than average transverse size. The application of the QCD Q2 evolution equations shows that these small configurations also have a significantly smaller interaction strength, which has observable consequences in proton -- nucleus collisions. We perform a global analysis of jet production data in proton-- and deuteron--nucleus collisions at RHIC and the LHC. Using a model which takes a distribution of interaction strengths into account, we quantitatively extract the xp-dependence of the average interaction strength, ?(xp), over a wide kinematic range. By comparing the RHIC and LHC results, our analysis finds that the interaction strength for small configurations, while suppressed, grows faster with collision energy than does that for average configurations. We check that this energy dependence is consistent with the results of a method which, given ?(xp) at one energy, can be used to quantitatively predict that at another. This finding further suggests that at even lower energies, nucleons with a large-xp parton should interact much more weakly than those in an average configuration, a phenomenon in line with explanations of the EMC effect for large-xp quarks in nuclei based on color screening.
Tran The Viet(1,3), Massimiliano Alvioli(2), Giha Lee(3), Hyun Uk An(4), 2018, Three-dimensional, time-dependent modeling of rainfall-induced landslides over a digital landscape_ a case study,
Landslides (Berl., Print) 15 (2018): 1071–1084. doi_10.1007/s10346-017-0931-7,
DOI: 10.1007%2Fs10346-017-0931-7
Abstract
Physically based approaches for the regional assessment of slope stability using DEM topography usually consist ...
Physically based approaches for the regional assessment of slope stability using DEM topography usually consist of one-dimensional descriptions and include many simplifying assumptions with respect to more realistic, three-dimensional analyses. We investigated a new application of the well-known, publicly available software TRIGRS (Transient Rainfall Infiltration and Grid-Based Regional Slope-Stability Analysis) in combination with Scoops3D, to analyze three-dimensional slope stability throughout a digital landscape in a time-dependent fashion, typically non implemented in three-dimensional models. TRIGRS was used to simulate the dynamic hydraulic conditions within the slopes induced by a rainstorm. Scoops3D then used the resulting pore water pressure for three-dimensional stability assessment. We applied this approach to the July 2011 landslide event in Mt. Umyeon, South Korea, and results were compared with the landslide initiation locations reported for this rainfall event. Soil depth in the study area was described by three different simple models. Stability maps, obtained by the one-dimensional (TRIGRS only) and three-dimensional (TRIGRS and Scoops3D), time-dependent approaches, were compared to observations to assess the timing and locations of unstable sites by means of a synthetic index, previously specifically developed for dealing with point landslide locations. We highlight the performance of the three-dimensional approach with respect to the one-dimensional method represented by TRIGRS alone, and the consistency of the time-dependence of the results obtained using the combined approach with observations.
Jalilvand E.; Tajrishy M.; Brocca L.; Massari C.; Ghazi Zadeh Hashemi S.; Ciabatta L., 2018, Estimating the drainage rate from surface soil moisture drydowns_ Application of DfD model to in situ soil moisture data,
Journal of hydrology (Amst.) 565 (2018): 489–501. doi_10.1016/j.jhydrol.2018.08.035,
DOI: 10.1016%2Fj.jhydrol.2018.08.035
Abstract
The large heterogeneity in soil surface conditions makes it impracticable to obtain reliable estimates of ...
The large heterogeneity in soil surface conditions makes it impracticable to obtain reliable estimates of soil hydraulic parameters for areas larger than few squared kilometers. However, identifying these parameters on a global scale is essential for many hydrological and climatic applications. In this study, a new approach named Drainage from Drydown (DfD) is proposed to estimate the coefficients of drainage using soil moisture observations. DfD firstly selects multiple drydown events when surface runoff and evapotranspiration rates are negligible compared to the drainage rate. Secondly, by inverting the soil water balance equation, the drainage coefficients are obtained. Synthetic experiments are carried out in order to tune the overall procedure. DfD is then tested with in situ observations at 8 different sites worldwide characterized by different climates and soil types. The reliability of the DfD is evaluated by using the DfD drainage coefficients in a physically based soil water balance model (SWB) for simulating soil moisture and a rainfall estimation model (SM2RAIN). The results indicate that the climate and the soil conditions exert an important role in the occurrence and magnitude of drainage rate. DfD is found capable of correctly identify periods in which drainage rate is the dominant process. Drainage coefficients obtained from DfD are consistent with the expected soil hydraulic properties based on the soil texture and land cover at each site. By using DfD drainage coefficients to estimate rainfall and soil moisture via SM2RAIN and SWB, promising results are obtained with median correlation of 0.83 and 0.91 between estimated and in situ data. However, in sites characterized by high rate of evapotranspiration (>700 mm/year) and low permeable soil (e.g., clay) the DfD performance is reduced. Overall, DfD demonstrates the ability to decouple drainage and evapotranspiration processes and to estimate the drainage coefficients from in situ observations.
Bauer-Marschallinger, Bernhard; Paulik, Christoph; Hochstoeger, Simon; Mistelbauer, Thomas; Modanesi, Sara; Ciabatta, Luca; Massari, Christian; Brocca, Luca; Wagner, Wolfgang, 2018, Soil Moisture from Fusion of Scatterometer and SAR_ Closing the Scale Gap with Temporal Filtering,
Remote sensing (Basel) 10 (2018). doi_10.3390/rs10071030,
DOI: 10.3390%2Frs10071030
Abstract
Soil moisture is a key environmental variable, important to e.g., farmers, meteorologists, and disaster management ...
Soil moisture is a key environmental variable, important to e.g., farmers, meteorologists, and disaster management units. We fuse surface soil moisture (SSM) estimates from spatio-temporally complementary radar sensors through temporal filtering of their joint signal and obtain a kilometre-scale, daily soil water content product named SCATSAR-SWI. With 25 km Metop ASCAT SSM and 1 km Sentinel-1 SSM serving as input, the SCATSAR-SWI is globally applicable and achieves daily full coverage over operated areas. We employ a near-real-time-capable SCATSAR-SWI algorithm on a fused 3 year ASCAT-Sentinel-1-SSM data cube over Italy, obtaining a consistent set of model parameters, unperturbed by coverage discontinuities. An evaluation of a therefrom generated SCATSAR-SWI dataset, involving a 1 km Soil Water Balance Model (SWBM) over Umbria, yields comprehensively high agreement with the reference data (median R = 0.61 vs. in situ; 0.71 vs. model; 0.83 vs. ASCAT SSM). While the Sentinel-1 signal is attenuated to some extent, the ASCAT's signal dynamics are fully transferred to the SCATSAR-SWI and benefit from the Sentinel-1 parametrisation. Using the SM2RAIN approach, the SCATSAR-SWI shows excellent capability to reproduce 5 day-accumulated rainfall over Italy, with R = 0.89 against observed rainfall. The SCATSAR-SWI is currently in preparation towards operational product dissemination in the Copernicus Global Land Service (CGLS).
Samuele Segoni (1), Luca Piciullo (2), Stefano Luigi Gariano (3), 2018, A review of the recent literature on rainfall thresholds for landslide occurrence,
Landslides (Berl., Internet) 15 (2018): 1483–1501. doi_10.1007/s10346-018-0966-4,
DOI: 10.1007%2Fs10346-018-0966-4
Abstract
The topic of rainfall thresholds for landslide occurrence was thoroughly investigated, producing abundance of case ...
The topic of rainfall thresholds for landslide occurrence was thoroughly investigated, producing abundance of case studies at different scales of analysis and several technical and scientific advances. We reviewed the most recent papers published in scientific journals, highlighting significant advances and critical issues. We collected and grouped all the information on rainfall thresholds into four categories_ publication details, geographical distribution and uses, dataset features, thresholds definition. In each category, we selected descriptive information to characterize each one of the 115 rainfall threshold published in the last 9 years.
The main improvements that stood out from the review are the definition of standard procedures for the identification of rainfall events and for the objective definition of the thresholds. Numerous advances were achieved in the cataloguing of landslides too, which can be defined as one of the most important variables, together with rainfall data, for drawing reliable thresholds. Another focal point of the reviewed articles was the increased definition of thresholds with different exceedance probabilities to be employed for the definition of warning levels in landslide early warning systems. Nevertheless, drawbacks and criticisms can be identified in most part of the recent literature on rainfall thresholds. The main issues concern the validation process, which is seldom carried out, and the very frequent lack of explanations for the rain gauge selection procedure.
The paper may be used as a guide to find adequate literature on the most used or the most advanced approaches followed in every step of the procedure for defining reliable rainfall thresholds. Therefore, it constitutes a guideline for future studies and applications, in particular in early warning systems. The paper also aims at addressing the gaps that need to be filled to further enhance the quality of the research products in this field. The contribution of this manuscript could be seen not only as a review of the state of the art, but also an effective method to disseminate the best practices among scientists and stakeholders involved in landslide hazard management.
Camici, S.; Ciabatta, L.; Massari, C.; Brocca, L., 2018, How reliable are satellite precipitation estimates for driving hydrological models_ A verification study over the Mediterranean area,
Journal of hydrology (Amst.) 563 (2018): 950–961. doi_10.1016/j.jhydrol.2018.06.067,
DOI: 10.1016%2Fj.jhydrol.2018.06.067
Abstract
Satellite-based rainfall products (SRPs) are nowadays available at ever increasing accuracy and higher spatial and ...
Satellite-based rainfall products (SRPs) are nowadays available at ever increasing accuracy and higher spatial and temporal resolution with respect to the past. Despite this, they are scarcely used in hydrological modeling. The main reasons may be related to_ 1) the large bias characterizing satellite precipitation estimates, which is dependent on rainfall intensity and the season, 2) the relatively large spatial/temporal resolution with respect to the applications, 3) the timeliness, which is often insufficient for operational purposes, and 4) a general (often not justified) skepticism of the hydrological community in the use of satellite products for land applications.
Thaler, Sabina; Brocca, Luca; Ciabatta, Luca; Eitzinger, Josef; Hahn, Sebastian; Wagner, Wolfgang, 2018, Effects of Different Spatial Precipitation Input Data on Crop Model Outputs under a Central European Climate,
Atmosphere (Basel) 9 (2018). doi_10.3390/atmos9080290,
DOI: 10.3390%2Fatmos9080290
Abstract
Crop simulation models, which are mainly being utilized as tools to assess the consequences of ...
Crop simulation models, which are mainly being utilized as tools to assess the consequences of a changing climate and different management strategies on crop production at the field scale, are increasingly being used in a distributed model at the regional scale. Spatial data analysis and modelling in combination with geographic information systems (GIS) integrates information from soil, climate, and topography data into a larger area, providing a basis for spatial and temporal analysis. In the current study, the crop growth model Decision Support System for Agrotechnology Transfer (DSSAT) was used to evaluate five gridded precipitation input data at three locations in Austria. The precipitation data sets consist of the INtegrated Calibration and Application Tool (INCA) from the Meteorological Service Austria, two satellite precipitation data sourcesMultisatellite Precipitation Analysis (TMPA) and Climate Prediction Center MORPHing (CMORPH)and two rainfall estimates based on satellite soil moisture data. The latter were obtained through the application of the SM2RAIN algorithm (SM2R(ASC)) and a regression analysis (RA(ASC)) applied to the Metop-A/B Advanced SCATtermonter (ASCAT) soil moisture product during a 9-year period from 2007-2015. For the evaluation, the effect on winter wheat and spring barley yield, caused by different precipitation inputs, at a spatial resolution of around 25 km was used. The highest variance was obtained for the driest area with light-textured soils; TMPA and two soil moisture-based products show very good results in the more humid areas. The poorest performances at all three locations and for both crops were found with the CMORPH input data.
Hdeib, Rouya; Abdallah, Chadi; Colin, Francois; Brocca, Luca; Moussa, Roger, 2018, Constraining coupled hydrological-hydraulic flood model by past storm events and post-event measurements in data-sparse regions,
Journal of hydrology (Amst.) 565 (2018): 160–176. doi_10.1016/j.jhydrol.2018.08.008,
DOI: 10.1016%2Fj.jhydrol.2018.08.008
Abstract
Flood modelling in data-sparse regions have been always limited to empirical, statistical or geomorphic approaches ...
Flood modelling in data-sparse regions have been always limited to empirical, statistical or geomorphic approaches that are suitable to produce regional hazard maps. Such coarse resolution maps are not adapted for basin-scale applications, small to medium sized basins (< 1000 km(2)), especially when detailed estimates of flows and water levels of a particular event is required and hence cannot replace the hydrological/hydraulic modelling. The latter is a challenging task in data-sparse regions characterized by floods of typical duration times of a few hours which offer little opportunity for real-time recording by traditional rain-gauge networks, remote sensing or satellite imaging. Such data sparseness is not always compatible with the resolution, in both space and time, of the hydrological and hydraulic models. We propose a framework for flood modelling using sparse data from a coupled hydrological-hydraulic model constrained by past storm events and post-event measurements in space. The approach is applied to the Awali river basin (301 km(2)), in Lebanon, particularly to simulate the investigated early January 2013 extreme flood event, which is considered one of the largest events in the last three decades. The hydrological model was calibrated and evaluated with 12 past storm events aiming at defining narrow parameter ranges and uncertainty was performed with Monte Carlo simulations for these parameter ranges. The hydraulic model, based on a fine resolution DEM, was simulated using hydrological outflows and validated with 27 post-event measurements in space of high water marks. The resulting outflow values were satisfactory, and uncertainty was reduced when compared with arbitrarily wide parameter ranges. The hydrological model performance was highly variable but for the hydraulic model, 93% of the observed water levels fall within the simulated uncertainty bounds with an RMSE error of 0.26 m. The proposed framework allows mapping the possible inundation and can be compared to other approaches dealing with model complexity and associated performances.
Brocca, Luca; Tarpanelli, Angelica; Filippucci, Paolo; Dorigo, Wouter; Zaussinger, Felix; Gruber, Alexander; Fernandez-Prieto, Diego, 2018, How much water is used for irrigation? A new approach exploiting coarse resolution satellite soil moisture products,
International journal of applied earth observation and geoinformation 73 (2018): 752–766. doi_10.1016/j.jag.2018.08.023,
DOI: 10.1016%2Fj.jag.2018.08.023
Abstract
Knowledge of irrigation is essential for ensuring food and water security, and to cope with ...
Knowledge of irrigation is essential for ensuring food and water security, and to cope with the scarcity of water resources, which is expected to exacerbate under the pressure of climate change and population increase. Even though irrigation is likely the most important direct human intervention in the hydrological cycle, we have only partial knowledge on the areas of our planet in which irrigation takes place, and almost no information on the amount of water that is applied for irrigation.
Donnini M., Napolitano E., Salvati P., Ardizzone F., Bucci F., Fiorucci F., Santangelo M., Cardinali M., Guzzetti F., 2017, Impact of event landslides on road networks_ a statistical analysis of two Italian case studies,
Landslides (Berl., Internet) (2017). doi_10.1007/s10346-017-0829-4,
DOI: 10.1007%2Fs10346-017-0829-4
Abstract
Despite abundant information on landslides, and on landslide hazard and risk, in Italy little is ...
Despite abundant information on landslides, and on landslide hazard and risk, in Italy little is known on the direct impact of event landslides on road networks, and on the related economic costs. We investigated the physical and economic damage caused by two rainfall-induced landslide events in Central and Southern Italy, to obtain road restoration cost statistics. Using a GIS-based method, we exploited road maps and landslide event inventory maps to compute different metrics that quantify the impact of the landslide events on the natural landscape, and on the road networks, by road type. The maps were used with cost data obtained from multiple sources, including local authorities, and specific legislation, to evaluate statistically the unit cost per metre of damaged road, and the unit cost per square metre of damaging landslide, separately for main and secondary roads. The obtained unit costs showed large variations which we attribute to the different road types in the two study areas and to the different abundance of landslides. Our work confirms the long-standing conundrum of obtaining accurate landslide damage data, and outlines the need for reliable, standardized methods to evaluate landslide damage and associated restoration costs that regional and local administrations can use rapidly in the aftermath of a landslide event. We conclude recommending that common standardized procedures to collect landslide cost data following each landslide event are established, in Italy and elsewhere. This will allow for more accurate and reliable evaluations of the economic costs of landslide events.