Camici, S. and Massari, C. and Ciabatta, L. and Marchesini, I. and Brocca, L., 2020, Which rainfall metric is more informative about the flood simulation performance? A comprehensive assessment on 1318 basins over Europe,
Hydrology and earth system sciences 2020 (2020): 1–35. doi_10.5194/hess-2020-31,
DOI: 10.5194%2Fhess-2020-31
Abstract
The global availability of satellite rainfall products (SRPs) at an increasingly high temporal/spatial resolution has ...
The global availability of satellite rainfall products (SRPs) at an increasingly high temporal/spatial resolution has made possible their exploitation in hydrological applications, especially over in-situ data scarce regions. In this context, understand how uncertainties transfer from SRPs into flood simulation, through the hydrological model, is a main research question.
SRPs accuracy is normally characterized by comparing them with ground observations via the calculation of categorical (e.g., threat score, false alarm ratio, probability of detection) and/or continuous (e.g., bias, root mean square error, Nash-Sutcliffe index, Kling-Gupta efficiency index, correlation coefficient) metrics. However, whether these metrics are informative about the associated performance in flood simulations (when the SRP is used as input to an hydrological model) is an underdiscussed research topic.
This study aims to relate the accuracy of different SRPs both in terms of rainfall and in terms of flood simulation. That is, the following research question are addressed_ is (are) there appropriate performance metric (s) to drive the choice of the best performing rainfall product for flood simulation? To answer this question three SRPs, namely the Tropical Rainfall Measurement Mission Multi-satellite Precipitation Analysis, TMPA; the Climate Prediction Center Morphing algorithm, CMORPH, and the SM2RAIN algorithm applied to the ASCAT (Advanced SCATterometer) soil moisture product, SM2RAIN-ASCAT, have been used as input into a lumped hydrologic model (MISDc, "Modello Idrologico Semi-Distribuito in continuo") on 1318 basins over Europe with different physiographic characteristics.
Results have suggested that, among the continuous metrics, correlation coefficient and Kling-Gupta efficiency index are not reliable scores to select rainfall product performing best for hydrological modelling whereas bias and root mean square error seem more appropriate. In particular, by constraining the relative bias to values lower than 0.2 and the relative root mean square error to values lower than 2, good hydrological performances (Kling-Gupta efficiency index on discharge greater than 0.5) are ensured for almost 75 % of the basins fulfilling these criteria. Conversely, the categorical scores have not provided suitable information to address the SRPs selection for hydrological modelling.
Marco Donnini and Marco Modica and Paola Salvati and Ivan Marchesini and Mauro Rossi and Fausto Guzzetti and Roberto Zoboli, 2020, Economic Landslide Susceptibility under a socio-economic perspective_ an application to Umbria Region (Central Italy),
EGU General Assembly 2020, 04/04/2020 - 08/04/2020,
Abstract
An accurate understanding of physical and economic effects of landslides is fundamental to develop more ...
An accurate understanding of physical and economic effects of landslides is fundamental to develop more refined risk management, mitigation strategies and land use policies. We develop a measure to consider the interconnection between physical and economic exposure, e.g. what we call the economic landslide susceptibility, namely the probability of landslide occurrence in an area weighted for its socio-economic exposure. The economic landslide susceptibility is estimated trough a pixel-based method designed for large areas. The method makes use of landslide susceptibility maps and a real estate market value maps for any given areas under analysis. We apply this methodology to the Umbria Region (Central Italy). The innovative concept of economic landslide susceptibility (that is de facto an ex ante landslide cost assessment) may be interpreted as the potential loss that an area might suffer in terms of its propensity for landslides. Useful applications of the proposed method lie in a better territorial management and in the land use planning.
Esposito, G. and Marchesini, I. and Mondini, A. C. and Reichenbach, P. and Rossi, M. and Sterlacchini, S., 2020, A spaceborne SAR-based procedure to support the detection of landslides,
Natural hazards and earth system sciences (Print) 2020 (2020): 1–26. doi_10.5194/nhess-20-2379-2020,
DOI: 10.5194%2Fnhess-20-2379-2020
Abstract
The increasing availability of free-access satellite data represents a relevant opportunity for the analysis and ...
The increasing availability of free-access satellite data represents a relevant opportunity for the analysis and assessment of natural hazards. The systematic acquisition of spaceborne imagery allows for monitoring areas prone to geohydrological disasters, providing relevant information for risk evaluation and management. In cases of major landslide events, for example, spaceborne radar data can provide an effective solution for the detection of slope failures, even in cases with persistent cloud cover. The information about the extension and location of the landslide-affected areas may support decision-making processes during emergency responses.
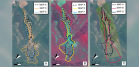
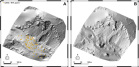
In this paper, we present an automatic procedure based on Sentinel-1 Synthetic Aperture Radar (SAR) images, aimed at facilitating the detection of landslides over wide areas. Specifically, the procedure evaluates changes of radar backscattered signals associated with land cover modifications that may be also caused by mass movements. After a one-time calibration of some parameters, the processing chain is able to automatically execute the download and preprocessing of images, the detection of SAR amplitude changes, and the identification of areas potentially affected by landslides, which are then displayed in a georeferenced map. This map should help decision makers and emergency managers to organize field investigations. The process of automatization is implemented with specific scripts running on a GNU/Linux operating system and exploiting modules of open-source software.
We tested the processing chain, in back analysis, on an area of about 3000 km2 in central Papua New Guinea that was struck by a severe seismic sequence in February-March 2018. In the area, we simulated a periodic survey of about 7 months, from 12 November 2017 to 6 June 2018, downloading 36 Sentinel-1 images and performing 17 change detection analyses automatically. The procedure resulted in statistical and graphical evidence of widespread land cover changes that occurred just after the most severe seismic events. Most of the detected changes can be interpreted as mass movements triggered by the seismic shaking.
Ivan Marchesini and Mauro Rossi and Paola Salvati and Marco Donnini and Simone Sterlacchini and Fausto Guzzetti, 2020, A data-driven statistical approach for flood hazard zoning at national scale,
EGU2020 European Geosciences Union General Assembly 2020, online, 4-8/05/2020,
Abstract
The delimitation of flood-prone areas is an important non-structural measure that proves to be effective ...
The delimitation of flood-prone areas is an important non-structural measure that proves to be effective in the long term in reducing food risk.
In Italy, more than 20 basin's Units of Management (UoMs) were in charge to delineate the flood hazard zoning (FHZ) for three different flood return periods. Mostly, FHZ was prepared using physically based models i.e., considering the rainfall-runoff transformation and simulating the flood discharge through the river network. Physically-based models require many inputs and boundary conditions including_ hydro-meteorological data, detailed characterization of the geometry of the riverbeds, roughness, infiltration parameters and also real hydrometric measurements in order to be calibrated. Physically based modelling is therefore a long, time consuming and resource intensive process that should be frequently updated to take into account the river channel changes. As a consequence, the Italian FHZ suffers from an underlying lack of homogeneity across the different UoMs, resulting in significant differences on the percentage of the river network for which the flood-prone areas were delineated.
As alternatives to physically based models, in recent years many authors have produced maps of flood susceptibility or hazard using expert (e.g. Analytic Hierarchy Process) or data-driven (e.g. multivariate statistics or machine learning) approaches. Such methods were mostly used in ungauged territories where hydro-meteorological data is not available.
Here we present a procedure, named Flood-SHE (Flood - Statistical Hazard Evaluation), which is aimed at the delineation of flood-prone areas and the corresponding expected water depth, using a multivariate statistical classification model. Flood-SHE was applied to the entire Italian territory with the aim to integrate the UOMs FHZ where it is not available or incomplete. The classification model was trained exploiting the existing UoMs FHZ and using, as independent variables, a set of geomorphometric layers (derived at 10x10 meters ground resolution) which includes the distance and height to the closest rivers and to the basins outlets, the local DEM slope, a stream order classification criterion and the DEM local roughness. Random training and validation areas were used for the classification model in order to obtain an estimation of the uncertainty of the values of the predictive performance indexes. Results highlight (i) the significance of the the variables distance and height to the closest rivers, roughness and stream order in predicting the flood-prone areas, (ii) the impact of the UoMs morphology and the quality of UoMs FHZ on the reliability of the statistically modeled flood-prone areas.
Luigi Lombardo, Thomas Opitz, Francesca Ardizzone, Fausto Guzzetti, Raphaël Huserd, 2020, Space-time landslide predictive modelling,
Earth Science Review (2020). doi_10.1016/j.earscirev.2020.103318,
DOI: 10.1016%2Fj.earscirev.2020.103318
Abstract
Landslides are nearly ubiquitous phenomena and pose severe threats to people, properties, and the environment ...
Landslides are nearly ubiquitous phenomena and pose severe threats to people, properties, and the environment in many areas. Investigators have for long attempted to estimate landslide hazard in an effort to determine where, when (or how frequently), and how large (or how destructive) landslides are expected to be in an area. This information may prove useful to design landslide mitigation strategies, and to reduce landslide risk and societal and economic losses. In the geomorphology literature, most of the attempts at predicting the occurrence of populations of landslides by adopting statistical approaches are based on the empirical observation that landslides occur as a result of multiple, interacting, conditioning and triggering factors. Based on this observation, and under the assumption that at the spatial and temporal scales of our investigation individual landslides are discrete "point" events in the landscape, we propose a Bayesian modelling framework for the prediction of the spatio-temporal occurrence of landslides of the slide type caused by weather triggers. We build our modelling effort on a Log-Gaussian Cox Process (LGCP) by assuming that individual landslides in an area are the result of a point process described by an unknown intensity function. The modelling framework has two stochastic components_ (i) a Poisson component, which models the observed (random) landslide count in each terrain subdivision for a given landslide "intensity", i.e., the expected number of landslides per terrain subdivision (which may be transformed into a corresponding landslide "susceptibility"); and (ii) a Gaussian component, used to account for the spatial distribution of the local environmental conditions that influence landslide occurrence, and for the spatio-temporal distribution of "unobserved" latent environmental controls on landslide occurrence. We tested our prediction framework in the Collazzone area, Umbria, Central Italy, for which a detailed multi-temporal landslide inventory covering the period from before 1941 to 2014 is available together with lithological and bedding data. We subdivided the 79 km2 area into 889 slope units (SUs). In each SU, we computed the mean and standard deviation of 16 morphometric covariates derived from a 10 m × 10 m digital elevation model. For 13 lithological and bedding attitude covariates obtained from a 1_10,000 scale geological map, we computed the proportion of each thematic class intersecting the given SU. We further counted how many of the 3,379 landslides in the multi-temporal inventory affect each SU and grouped them into six periods. We used this complex space-time information to prepare five models of increasing complexity. Our "baseline" model (Mod1) carries the spatial information only through the covariates mentioned above. It does not include any additional information about the spatial and temporal structure of the data, and it is therefore equivalent to the predominantly used landslide susceptibility model in the literature. The second model (Mod2) is analogous, but it allows for time-interval-specific regression constants. Our next two models are more complex. In particular, our third model (Mod3) also accounts for latent spatial dependencies among neighboring SUs. These are inferred for each of the six time intervals, to explain variations in the landslide intensity and susceptibility not explained by the thematic covariates. By contrast, our fourth model (Mod4) accounts for the latent temporal dependence, separately for each SU, disregarding neighboring influences. Ultimately, our most complex model (Mod5) contextually features all these relations. It contains the information carried by morphometric and thematic covariates, six time-interval-specific regression constants, and it also accounts for the latent temporal effects between consecutive slope instabilities at specific SUs as well as the latent spatial effects between adjacent SUs. We also show that the intensity is strongly related to the aggregated landslide area per SU. Because of this, our most complex model largely fulfills the definition of landslide hazard commonly accepted in the literature, at least for this study area. We quantified the spatial predictive performance of each of the five models using a 10-fold cross-validation procedure, and the temporal predictive performance using a leave-one-out cross-validation procedure. We found that Mod5 performed better than the others. We then used it to test a novel strategy to classify the model results in terms of both landslide intensity and susceptibility, which provides more information than traditional susceptibility zonations for land planning and management--hereafter we use the term "traditional" simply to refer to the majority of modelling procedures in the literature. We discuss the advantages and limitations of the new modelling framework, and its potential application in other areas, making specific and general hazard and geomorphological considerations. We also give a perspective on possible developments in landslide prediction modelling and zoning. We expect our novel approach to the spatio-temporal prediction of landslides to enhance the currently limited ability to evaluate landslide hazard and its temporal and spatial variations. We further expect it to lead to better projections of future landslides, and to improve our collective understanding of the evolution of complex landscapes dominated by mass-wasting processes under multiple geophysical and weather triggers.
Mauro Rossi, Margehrita Agostini, 2020, Project BIOESSANS – R4.3a Updated slope dynamics & R4.3b Scenario modeling simulations,
2020,
Abstract
The document describes slope dynamics modelling activities and the relative scenarios run in the surrounding ...
The document describes slope dynamics modelling activities and the relative scenarios run in the surrounding the sacred site of Monte Oliveto Maggiore located in Tuscany, Central Italy, threatened by geo-hydrological instability phenomenon. Such activities have been carried out in the framework of WP4 integrating data collected during the project and using specific modelling approaches developed within WP4.
Marco Donnini, Mauro Rossi, Francesca Ardizzone, Dino Torri, Ivan Marchesini, Federico Fugnoli, 2020, Project BIOESSANS – R4.2 Risultati Test Sperimentali,
2020,
Abstract
Questo documento descrive le attività sperimentali effettuate da CNR IRPI nell'ambito del WP4 e in ...
Questo documento descrive le attività sperimentali effettuate da CNR IRPI nell'ambito del WP4 e in particolare dell'attività T4.2. Tali analisi sono state effettuate congiuntamente con CNR IBBR raccogliendo dati in corrispondenza di 4 siti sacri identificati in accordo a UNIBO. Su ogni sito sono stati effettuati test sperimentali nelle immediate vicinanze e sotto la diretta influenza del sito sacro (SNS) e ad una determinata distanza dal sito (RS) in assenza della possibile influenza del sito (RS). I risultati di tali attività sono stati rielaborati sotto forma di mappe geo-ambientali (deliverable R4.1) e caricate sulla Spatial Data Infrastructure realizzata nell'ambito del progetto e descritta nel deliverable R1.2.
Ivan Marchesini, Mauro Rossi, 2020, Project BIOESSANS – R4.1 Data comparison between SNS and RS “Identification of the area of influence of sacred sites”,
2020,
Abstract
Historical sacred sites are spread all across Italy. They are commonly ancient abbeys and/or historical ...
Historical sacred sites are spread all across Italy. They are commonly ancient abbeys and/or historical buildings located in different morphological and climatic conditions. Landscape, vegetation and morphology has been affected, along centuries, by the human activities of the communities living into or close to the sacred sites. We define "area of influence" the portion of the territory that is close enough, to the sacred sites, to be reached by foot by humans. Here we describe the method that was used to define the area of influence for 2332 sacred sites in Italy. Such activities provide information useful for the Data comparison between SNS and RS (R4.1) and they have been carried out in the framework of WP4.
Francesca Ardizzone, Ivan Marchesini, Mauro Rossi, Marco Donnini, 2020, Project BIOESSANS – R1.2 Spatial Data Infrastructure,
2020,
Abstract
The report describes the Open Source Geonode platform for sharing project data and metadata created ...
The report describes the Open Source Geonode platform for sharing project data and metadata created in the framework WP1 (Task 1.2).
The platform was created using the Open Source infrastructure called Geonode and accessible via credentials at the web address indicated below_
http_//grievous.irpi.cnr.it/account/login/?next=/
Fourteen users were registered to access to the platform. The users were divided into four groups, one per Scientifc Unit_ 1) CNR IRPI, Istituto di Ricerca per la Protezione Idrogeologica del Consiglio Nazionale delle Ricerche; 2) UniBo, Dipartimento di Scienze Biologiche, Geologiche e Ambientali dell'Università ALMA MATER di Bologna; 3) CNR IBBR, Istituto di Bioscienze e Biorisorse del Consiglio Nazionale delle Ricerche; and 4) UniSG, Università degli Studi di SCIENZE GASTRONOMICHE Pollenza (MC).
Mauro Rossi, Paola Salvati, Francesca Ardizzone, 2020, Relazione illustrativa attività CNR IRPI,
2020,
Abstract
Il presente documento denominato "Relazione illustrativa attività CNR IRPI" sintetizza ai fini della rendicontazione le ...
Il presente documento denominato "Relazione illustrativa attività CNR IRPI" sintetizza ai fini della rendicontazione le attività realizzate dal CNR IRPI nell'ambito del progetto ADAPT di cui alla Convenzione approvata in schema con Delibera della Giunta Comunale n. 437 del 04/12/2017 e con Decisione a Contrattare n. E-016-2017 del 30/11/2017, avente ad oggetto la disciplina dei rapporti tra il Comune della Spezia e il Consiglio Nazionale delle Ricerche, Istituto di Ricerca per la Protezione Idrogeologica, per regolare le attività di interesse comune nell'ambito del progetto ADAPT "Assistere l'aDAttamento ai cambiamenti climatici dei sistemi urbani dello sPazio di cooperazione Transfrontaliera" CUP B19J16002890007, ammesso a finanziamento in adesione al primo Avviso del Programma Operativo di Cooperazione Transfrontaliera Interreg Italia Francia Marittimo 2014-2020. Le attività realizzate da CNR IRPI, svolte nel periodo dicembre 2017 - febbraio 2020, risultano identificate all'Art 4 della convenzione e ulteriormente caratterizzate nell'Allegato Tecnico.
Kariminejad, Narges and Hosseinalizadeh, Mohsen and Pourghasemi, Hamid Reza and Ownegh, Majid and Rossi, Mauro, 2020, Factors Affecting Gully-Head Activity in a Hilly Area Under a Semiarid Climate in Iran,
, pp. 369–380, 2020,
Abstract
Gully-head has been observed in a wide range of continuous and categorical conditioning factors in ...
Gully-head has been observed in a wide range of continuous and categorical conditioning factors in different countries. This study aimed to examine the association of gully-heads with the most effective hydrologic factors via univariate and bivariate analyses in the standard mode. A 2700 ha area in the loess-covered region of Iran was selected and the point map of 287 gully-heads prepared by unmanned aerial vehicle (UAV) images. The pattern of gully-heads was evaluated using univariate tests (O(r) &g(r)). The occurrence of gully-heads in relation to the linear features including road networks (RNS) and stream networks(SNS) was assessed using bivariate correlation tests(O12(r) g12(r)). The analysis mode in mark correlation function (kmm(r)) was applied for soil particles categorized into three groups by size including clay, sand, and silt content. The Mont Carlo simulation intervals were also conducted based on fifth highest and lowest values of the summary statistic of 199 simulated null model data sets. According to the results of the univariate spatial statistics, gully-heads had an aggregated distribution. The bivariate O-ring and pair correlation (g12(r)) test revealed that gully-heads had positive interactions with RNS and SNS. Based on mark correlation function kmm(r), clay content of nearby gully-heads was consistently smaller than the mean value of clay content (?2 = 22.93%) in the study area. However, the silt contents of nearby gully-heads were significantly larger than the mean value of silt content (?2 = 64.58%). The mean sand contents (?2 = 14.75%) do not differ from the mean sand contents taken over all pair gully-heads. Consequently, compared to other interoperation, the suggested approach prepares a proper technique to erosion research community which would be of interest to policy makers and geomorphologists.
Melzner, Sandra; Rossi, Mauro; Guzzetti, Fausto, 2020, Impact of mapping strategies on rockfall frequency-size distributions,
Engineering geology 272 (2020). doi_10.1016/j.enggeo.2020.105639,
DOI: 10.1016%2Fj.enggeo.2020.105639
Abstract
Rockfall frequency size distributions are used in Austria for the definition of a design block ...
Rockfall frequency size distributions are used in Austria for the definition of a design block for the planning of technical rockfall protection. Rockfall size datasets are often incomplete. Here, we study fifteen catalogues of rockfall size in Austria, Italy, and the USA to analyse the impact of the data collection and mapping methods on the representativeness of the catalogues and on the estimates of frequency-size statistics. To describe and compare the catalogues of rockfall size, we first use Empirical Cumulative Distribution Functions (ECDFs), followed by parametric distribution estimates in the form of Probability Density Functions (PDFs), and Cumulative Distribution Functions (CDFs). We discuss the output of Kolmogorov-Smirnov tests, the position of the frequency-size distribution rollover, and the p-value and the standard errors associated to the distribution parameters estimates to determine the reliability of our model results. In addition, we analyse the variations in the modelled CDFs for different percentiles of the frequency-size distributions to describe and discuss the representativeness of the rockfall catalogues. Our results show that different mapping strategies may affect the estimates of frequency-size distribution of rock fall volume, a relevant information when evaluating the possible impacts of rockfall processes. We conclude offering recommendations for rockfall mapping, and the use and of a non-parametric statistical method being capable to deal with small datasets, which is very typical when dealing with rockfall data. Such recommendations help for a correct dimensioning of designing rockfall mitigation measures.
Kariminejad, Narges; Rossi, Mauro; Hosseinalizadeh, Mohsen; Pourghasemi, Hamid Reza; Santosh, M., 2020, Gully head modelling in Iranian Loess Plateau under different scenarios,
Catena (Cremling.) 194 (2020). doi_10.1016/j.catena.2020.104769,
DOI: 10.1016%2Fj.catena.2020.104769
Abstract
Gully head erosion is a significant process in semi-arid regions contributing to land degradation and ...
Gully head erosion is a significant process in semi-arid regions contributing to land degradation and hillslope dynamics. Predicting when and where gully heads will expand under different seasonal scenarios is an essential step to take the appropriate mitigation measures. The LANDPLANER model was applied in this study area in order to analyze and investigate specific issues related to the triggering of gully head processes. The model is mainly designed to describe the dynamic response of slopes (or basins) under changing scenarios, including meteorological factors, vegetation or land use, and slope morphology. This model enabled us to predict the occurrence of gully heads under different seasonal conditions defined by Curve Number and rainfall scenarios. The LANDPLANER erosion modeling schema is twofold and integrates two different approaches. The first is empirical and exploits an erosion topographic threshold equation, while the second is aimed to define an erosion index calculated starting from the results of the hydrological model. These two indices predict where erosion processes can occur. To analyze the impact of land use changes on slope response to rainfall events, we simulated seasonal land use changes scenarios, modifying the Curve Number values associated to each specific land use classes. The twofold strategy was also adopted to validate the model, namely testing the model with synthetic dataset, and applying the model to real cases. The results indicated that the density of gully heads is more frequent in the South facing slopes with low elevation (around 200-300 m), steeper slope (within 20-40°), and higher average accumulation value (>100 m). Higher values of topographic threshold and erosion index (region 1_ 13.1, region 2_ 8.9) are obtained for the cold season in winter, where rainfall is intense and vegetation cover is lowest in the rangelands. Given to both observing receiver operating characteristic curve, the best and worst performances of gully head occurrence belong to the third Curve Number scenario (the lowest vegetation cover in terms of rangelands in winter) and the second Curve Number scenario (the lowest vegetation covers in terms of agricultural lands in summer) in turn. Further, the LANDPLANNER model effectively characterizes the status and trend of gully head formation in the study area.
Kariminejad, Narges; Hosseinalizadeh, Mohsen; Pourghasemi, Hamid Reza; Ownegh, Majid; Rossi, Mauro; Tiefenbacher, John P., 2020, Optimizing collapsed pipes mapping_ Effects of DEM spatial resolution,
Catena (Cremling.) 187 (2020). doi_10.1016/j.catena.2019.104344,
DOI: 10.1016%2Fj.catena.2019.104344
Abstract
Finding a digital elevation model (DEM) of suitable spatial resolution is vital to investigate piping ...
Finding a digital elevation model (DEM) of suitable spatial resolution is vital to investigate piping erosion using aerial remote-sensing platforms like unmanned aerial vehicles (UAV). Previous studies have implied that the best spatial resolution is a DEM with the most detail. This study evaluates piping-affected areas with five DEMs (1, 5, 10, 20, and 30 m resolutions) with three trained machine-learning methods_ support vector machine (SVM), maximum entropy (ME), and boosted regression tree (BRT). This method enables the identification of the specific impacts caused by changing pixel resolution to guide the selection of the most effective DEM. This study employs piping morphometry data to predict the locations of completely collapsed pipes. The performance of the methods for mapping of pipes was assessed against a piping inventory map. The results demonstrate that the finest resolution DEM is not always the most useful. Though 1 m-resolution DEMs show the most detail, the best performance was the 5 m-resolution DEM when tested for all three mapping models. The 5 m-resolution DEM-SVM combination was the best predictor of known piping sites (AUC = 81.0%). The 5-m DEM-ME was second most effective model (AUC = 75.8%). And 5-m DEM-BRT was third (AUC = 72.9%). Applying more DEM derivatives may increase confidence in the selection of the most appropriate resolution.
R. Sarro(1), R. M. Mateos(1), P. Reichenbach(2), H. Aguilera(3), A. Riquelme(4), L. E. Hernández-Gutiérrez(5), A. Martín(1), A. Barra(6), L. Solari(6), O. Monserrat(6), M. Alvioli(2), José A. Fernández-Merodo(1), J. López-Vinielles(1, 7), G.Herrera(1), 2020, Geotechnics for rockfall assessment in the volcanic island of Gran Canaria (Canary Islands, Spain),
2020,
Abstract
The island of Gran Canaria (Canary Islands, Spain) is characterized by a large variability of ...
The island of Gran Canaria (Canary Islands, Spain) is characterized by a large variability of volcanic rocks, reflecting its volcanic evolution resulting from the built-up process of an intraplate oceanic island. The geological map provided by Geological Survey of Spain at 1_25.000 scale shows more than 109 different lithologies and it is too complex for environmental and engineering purposes. This work presents a simplified geotechnical map with a small number of classes grouping up units with similar geotechnical behaviours. The original lithologies were grouped using about 350 representative rock samples, collected in the seven major islands of the Archipelago. The samples were characterized by laboratory tests and in situ analysis. The geotechnical map was used to model and evaluate rockfall hazard in the entire island of Gran Canaria, where rockfalls are an important threat with a high social, economic impact. The rockfall map was validated with 128 rockfall events, occurred during the period 2010-2016, along the GC-200 road (34 Km), located in the NW sector of Gran Canaria. About 96% of the events occurred along sections of the road where the number of expected trajectories is high or moderate.
R. Sarro(1), R. M. Mateos(1), P. Reichenbach(2), H. Aguilera(3), A. Riquelme(4), L. E. Hernández-Gutiérrez(5), A. Martín(1), A. Barra(6), L. Solari(6), O. Monserrat(6), M. Alvioli(2), José A. Fernández-Merodo(1), J. López-Vinielles(1,7), G.Herrera(1), 2020, Geotechnics for rockfall assessment in the volcanic island of Gran Canaria (Canary Islands, Spain),
Journal of maps (2020). doi_10.1080/17445647.2020.1806125,
DOI: 10.1080%2F17445647.2020.1806125
Abstract
The island of Gran Canaria (Canary Islands, Spain) is characterized by a large variability of ...
The island of Gran Canaria (Canary Islands, Spain) is characterized by a large variability of volcanic rocks, reflecting its volcanic evolution resulting from the built-up process of an intraplate oceanic island. The geological map provided by Geological Survey of Spain at 1_25.000 scale shows more than 109 different lithologies and it is too complex for environmental and engineering purposes. This work presents a simplified geotechnical map with a small number of classes grouping up units with similar geotechnical behaviours. The original lithologies were grouped using about 350 representative rock samples, collected in the seven major islands of the Archipelago. The samples were characterized by laboratory tests and in situ analysis. The geotechnical map was used to model and evaluate rockfall hazard in the entire island of Gran Canaria, where rockfalls are an important threat with a high social, economic impact. The rockfall map was validated with 128 rockfall events, occurred during the period 2010-2016, along the GC-200 road (34 Km), located in the NW sector of Gran Canaria. About 96% of the events occurred along sections of the road where the number of expected trajectories is high or moderate.
Franz, T., Wahbi, A., Zhang, J., Vreugdenhil, M., Heng, L., Dercon, G., Strauss, P., Brocca, L., Wagner, W., 2020, Practical Data Products From Cosmic-Ray Neutron Sensing for Hydrological Applications,
Frontiers (Los Angel. Calif.) (2020): 2–9. doi_10.3389/frwa.2020.00009,
DOI: 10.3389%2Ffrwa.2020.00009
Abstract
The Cosmic-Ray Neutron Sensor (CRNS) technique for estimating landscape average soil water content (SWC) is ...
The Cosmic-Ray Neutron Sensor (CRNS) technique for estimating landscape average soil water content (SWC) is now a decade old and includes many practical methods for implementing measurements, such as identification of detection area and depth and determining crop biomass water equivalent. However, in order to maximize the societal relevance of CRNS SWC data, practical value-added products need to be developed that can estimate both water flux (i.e., rainfall, deep percolation, evapotranspiration) and root zone SWC changes. In particular, simple methods that can be used to estimate daily values at landscape average scales are needed by decision makers and stakeholders interested in utilizing this technique. Moreover, landscape average values are necessary for better comparisons with remote sensing products. In this work we utilize three well-established algorithms to enhance the usability of the CRNS data. The algorithms aim to_ (1) temporally smooth the neutron intensity and SWC time series, (2) estimate a daily rainfall product using the Soil Moisture 2 Rain (SM2RAIN) algorithm, and (3) estimate daily root zone SWC using an exponential filter algorithm. The algorithms are tested on the CRNS site at the Hydrological Open Air Laboratory experiment in Petzenkirchen, Austria over a 3 years period. Independent observations of rainfall and point SWC data are used to calibrate the algorithms. With respect to the neutron filter, we found the Savitzky-Golay (SG) had the best results in preserving the amplitude and timing of the SWC response to rainfall as compared to the Moving Average (MA), which shifted the SWC peak by 2-4 h. With respect to daily rainfall using the SM2RAIN algorithm, we found the MA and SG filters had similar results for a range of temporal windows (3-13 h) with cumulative errors of <9% against the observations. With respect to daily root zone SWC, we found all filters behaved well (Kling-Gupta-Efficiency criteria > 0.9). A methodological framework is presented that summarizes the different processes, required data, algorithms, and products.
Ciabatta, Luca; Camici, Stefania; Massari, Christian; Filippucci, Paolo; Hahn, Sebastian; Wagner, Wolfgang; Brocca, Luca, 2020, Soil moisture and precipitation_ The SM2RAIN algorithm for rainfall retrieval from satellite soil moisture,
, pp. 1013–1027, 2020,
Abstract
The standard approach for measuring instantaneous rainfall rates from
space is based on the inversion of ...
The standard approach for measuring instantaneous rainfall rates from
space is based on the inversion of the atmospheric signals reflected or radiated by
atmospheric hydrometeors, i.e., a "top-down" approach. Recently, a new "bottomup"
approach has been proposed that exploits satellite soil moisture observations for
obtaining accumulated rainfall estimates. The approach, referred to as SM2RAIN, is
based on the inversion of the hydrological water balance. In this chapter, after a short
description of the SM2RAIN algorithm and its application to satellite soil moisture
data, the two most recent satellite rainfall products obtained by the application of
SM2RAIN to ESA-CCI (European Space Agency - Climate Change Initiative) and
ASCAT (Advanced SCATterometer) soil moisture products are illustrated. Then, we
have investigated the use of SM2RAIN-derived rainfall products, in comparison
with "top-down" precipitation products, for improving flood forecasting over
600 basins in Europe. Finally, the limitations of the SM2RAIN algorithm and the
future research and technological developments to address such limitations are
provided.
Morbidelli R.; Garcia-Marin A.P.; Mamun A.A.; Atiqur R.M.; Ayuso-Munoz J.L.; Taouti M.B.; Baranowski P.; Bellocchi G.; Sanguesa-Pool C.; Bennett B.; Oyunmunkh B.; Bonaccorso B.; Brocca L.; Caloiero T.; Caporali E.; Caracciolo D.; Casas-Castillo M.C.; G.Catalini C.; Chettih M.; Kamal Chowdhury A.F.M.; Chowdhury R.; Corradini C.; Custo J.; Dari J.; Diodato N.; Doesken N.; Dumitrescu A.; Estevez J.; Flammini A.; Fowler H.J.; Freni G.; Fusto F.; Garcia-Barron L.; Manea A.; Goenster-Jordan S.; Hinson S.; Kanecka-Geszke E.; Kar K.K.; Kasperska-Wolowicz W.; Krabbi M.; Krzyszczak J.; Llabres-Brustenga A.; Ledesma J.L.J.; Liu T.; Lompi M.; Marsico L.; Mascaro G.; Moramarco T.; Newman N.; Orzan A.; Pampaloni M.; Pizarro-Tapia R.; Puentes Torres A.; Rashid M.M.; Rodriguez-Sola R.; Manzor M.S.; Siwek K.; Sousa A.; Timbadiya P.V.; Filippos T.; Vilcea M.G.; Viterbo F.; Yoo C.; Zeri M.; Zittis G.; Saltalippi C., 2020, The history of rainfall data time-resolution in a wide variety of geographical areas,
Journal of hydrology (Amst.) 590 (2020). doi_10.1016/j.jhydrol.2020.125258,
DOI: 10.1016%2Fj.jhydrol.2020.125258
Abstract
Collected rainfall records by gauges lead to key forcings in most hydrological studies. Depending on ...
Collected rainfall records by gauges lead to key forcings in most hydrological studies. Depending on sensor type and recording systems, such data are characterized by different time-resolutions (or temporal aggregations), t. We present an historical analysis of the time-evolution of t based on a large database of rain gauge networks operative in many study areas. Globally, t data were collected for 25,423 rain gauge stations across 32 geographic areas, with larger contributions from Australia, USA, Italy and Spain. For very old networks early recordings were manual with coarse time-resolution, typically daily or sometimes monthly. With a few exceptions, mechanical recordings on paper rolls began in the first half of the 20th century, typically with t of 1 h or 30 min. Digital registrations started only during the last three decades of the 20th century. This short period limits investigations that require long time-series of sub-daily rainfall data, e.g, analyses of the effects of climate change on short-duration (sub-hourly) heavy rainfall. In addition, in the areas with rainfall data characterized for many years by coarse time-resolutions, annual maximum rainfall depths of short duration can be potentially underestimated and their use would produce errors in the results of successive applications. Currently, only 50% of the stations provide useful data at any time-resolution, that practically means t = 1 min. However, a significant reduction of these issues can be obtained through the information content of the present database. Finally, we suggest an integration of the database by including additional rain gauge networks to enhance its usefulness particularly in a comparative analysis of the effects of climate change on extreme rainfalls of short duration available in different locations.
Massimiliano Alvioli, 2020, Administrative boundaries and urban areas in Italy_ a perspective from scaling laws,
Landscape and urban planning 204 (2020). doi_10.1016/j.landurbplan.2020.103906,
DOI: 10.1016%2Fj.landurbplan.2020.103906
Abstract
Delineating boundaries of urban areas is no easy task, due to the inherent complexity of ...
Delineating boundaries of urban areas is no easy task, due to the inherent complexity of the problem, heterogeneity of relevant data and little consensus on how to properly measure the results. Any such delineation must eventually be cast onto administrative boundaries, an essential requirement for real-world applications. In the effort of relating administrative and alternative boundaries, we investigated in Italy the validity of general scaling laws, such as the area-population relation, and proposed a practical application. Relying on open data for population, settlements and road networks, we showed the extent to which scaling relations hold for different boundaries for urban areas, and how they compare to each other. We considered, beside Italian municipalities, urban areas based on the idea of "natural cities", obtained using head/tail breaks of areas related to human mobility as an explicit indicator of existence of a city. Area-population data for administrative boundaries can be reconciled with scaling relations valid for both the world's cities data and with those obtained from natural cities, provided an effective area is adopted in place of polygon planimetric area of municipalities. We eventually proposed an aggregation of administrative units using the empirical scaling relation as an objective function for accepting or rejecting pairwise fusion of boundaries. We suggest considering such a method, along with expert considerations, as an additional tool for real-world urban planning as seen from the very general perspective of seemingly abstract scaling laws.
Guoqiang Jia 1, Massimiliano Alvioli 2, Stefano Gariano 2, Fausto Guzzetti 2, Qiuhong Tang 1, and Ivan Marchesini 2, 2020, A Global Landslide Non-Susceptibility Map_ variation and applicability,
EGU2020 European Geosciences Union General Assembly 2020, online, 4-8/05/2020,
Abstract
Areas non susceptible to landslides are regions where landslides are not expected, or where susceptibility ...
Areas non susceptible to landslides are regions where landslides are not expected, or where susceptibility is negligible. Thus they can provide new insights into landslide hazard assessment and land use management and can be targeted as areas for urban planning and dwelling. Non-susceptible landslide areas can be determined with substantially less information as compared with landslide susceptibility. Previous works in Italy and the Mediterranean region and in the USA showed that only morphometric information is needed to distinguish non-susceptible landslide areas. We used 90-m digital terrain data (SRTM DEM V4.1) to calculate global slope and relief maps, and applied globally the quantile non-linear (QNL) model previously obtained in Italy. We define the output map a global landslide non-susceptibility map (GLNSM). The QNL model is a relationship between terrain relief and slope based on an Italian landslide inventory dataset with high completeness and accuracy. Results indicate that 82.89% of the landmasses are non-susceptible areas across the globe, which is more than the percentage of non-mountainous areas (73.6% based on GEO-GNOME). We further considered GLNSM in relation to global climate, elevation, geology, land use, precipitation and seismicity classifications. High percentage (more than 85.0%) of non-susceptible areas are detected in the tropical and arid, flat (low than 500 m), sedimentary, artificial and high vegetated, less rainy (less than 400 mm per year) and seismicity inactive (less than 0.4) regions. Our results of GLNSM was also validated with some well-represented regional landslide inventory datasets, for which we used four national (Austria, China, Ireland and USA) datasets and nine regional (Arizona, Missouri, Oregon, Utah and Washington in USA, Guangdong and Yunnan in China, and Koshi river region in Nepal) datasets. Applicability of GLNSM reveals that 0.7% of non-susceptible areas are covered by artificial structures, about three times of that in susceptible areas (i.e., not non-susceptible areas), while population density of non-susceptible areas are about twice of that in susceptible areas. About 90.5% of population resides in the non-susceptible areas.
Michele Calvello 1, Graziella Devoli 2, Katy Freeborough 3, Stefano Luigi Gariano 4, Fausto Guzzetti 5, Helen J. Reeves 3, Manfred Stähli 6, and the LEWS2020 workshop participants, 2020, LEWS2020 workshop on regional Landslide Early Warning Systems – experiences, progresses and needs,
EGU2020 European Geoscienes Union General Assembly 2020, online, 4-8/05/2020,
Abstract
In January 2020, the Istituto di Ricerca per la Protezione Idrogeologica of the Italian National ...
In January 2020, the Istituto di Ricerca per la Protezione Idrogeologica of the Italian National Research Council, the British Geological Survey, the Norwegian Water Resources and Energy Directorate, the Swiss Federal Institute for Forest, Snow and Landscape Research, and the University of Salerno - Italy have organised a 3-day workshop on regional Landslide Early Warning Systems (LEWS). The workshop, held in Perugia, Italy, follows a previous meeting held in Oslo, Norway, in October 2016. The main aims of the initiative are_ to collect experiences from worldwide invited experts involved in the design, the development, the operation or the analysis of LEWS, and to exchange knowledge, experiences, challenges and best practices.
The first day of the workshop is dedicated to presentations from identified participants on specific topics relevant for the optimal design, implementation, and operation of global, national and regional LEWS. This is followed by a long discussion session, aimed at addressing many of the issues that are relevant for regional LEWS, including system performance, warning communication and involvement of the stakeholders. The second day is organized around four round tables on the following four topics_ (i) data; (ii) landslide forecast models; (iii) warning models; (iv) scope, management structure, stakeholder involvement, and communication. The third day is focused on summarizing and formalizing the main issues discussed in an open document to be later shared with colleagues interested in LEWS.
The final purpose of the workshop is to establish and consolidate a community of experts in LEWS and to build relationships with other communities (e.g., meteorologists, climate scientists, communications scientists). This will help to level up the quality of both theory and practice, and to define standards in early warnings in order to provide timely advisories and to initiate emergency responses to landslides (particularly rainfall-induced) avoiding or reducing life and economic losses. The main outcomes of the workshop, the most debated issues, and the key recommendations included in the open document will be presented and shared.
Stefano Luigi Gariano, Samuele Segoni, Luca Piciullo, 2020, Advances in Rainfall Thresholds for Landslide Triggering in Italy,
Applied Geology. Approaches to Future Resource Management, edited by Marina De Maio, Ashwani Kumar Tiwari, pp. 247–263. Basel_ Springer Nature Switzerland, 2020,
Abstract
We reviewed the Italian scientific literature published in the period 2008-2018 on the topic of ...
We reviewed the Italian scientific literature published in the period 2008-2018 on the topic of rainfall thresholds for the landslide triggering, with the aim of analyzing the most significant advances and the main open issues. In the international literature, Italy occupies a relevant position from both a quantitative and a qualitative viewpoint_ 65 out of the 163 thresholds published worldwide in the considered period are defined in Italy. The main improvements can be ascribed to rigorous cataloguing of landslides; definition of standard and objective methods for thresholds analysis; quantitative validation of the results and evaluation of the performance of related warning systems; attempts to improve the spatial resolution of the forecasts. However, some shortcomings still limit the research on landslide rainfall thresholds and some open issues recently emerged as priorities to be further investigated_ the effects of climatic and environmental changes on the thresholds; their implementation into hazard management procedures and early warning systems; the adoption of combined approaches to account for the hydrological conditions of the slopes; the quantification of diverse uncertainties. This review disseminates the best practices among scientists and stakeholders involved in landslide hazard management, and it draws a national framework of procedures for defining reliable rainfall thresholds, in particular for early warning purposes.
Gruber, A.; De Lannoy, G.; Albergel, C.; Al-Yaari, A.; Brocca, L.; Calvet, J. C.; Colliander, A.; Cosh, M.; Crow, W.; Dorigo, W.; Draper, C.; Hirschi, M.; Kerr, Y.; Konings, A.; Lahoz, W.; McColl, K.; Montzka, C.; Muñoz-Sabater, J.; Peng, J.; Reichle, R.; Richaume, P.; Rüdiger, C.; Scanlon, T.; van der Schalie, R.; Wigneron, J. P.; Wagner, W., 2020, Validation practices for satellite soil moisture retrievals_ What are (the) errors?,
Remote sensing of environment 244 (2020). doi_10.1016/j.rse.2020.111806,
DOI: 10.1016%2Fj.rse.2020.111806
Abstract
This paper presents a community effort to develop good practice guidelines for the validation of ...
This paper presents a community effort to develop good practice guidelines for the validation of global coarse-scale satellite soil moisture products. We provide theoretical background, a review of state-of-the-art methodologies for estimating errors in soil moisture data sets, practical recommendations on data pre-processing and presentation of statistical results, and a recommended validation protocol that is supplemented with an example validation exercise focused on microwave-based surface soil moisture products. We conclude by identifying research gaps that should be addressed in the near future.
Massari, Christian; Brocca, Luca; Pellarin, Thierry; Abramowitz, Gab; Filippucci, Paolo; Ciabatta, Luca; Maggioni, Viviana; Kerr, Yann; Prieto, Diego Fernandez, 2020, A daily 25km short-latency rainfall product for data-scarce regions based on the integration of the Global Precipitation Measurement mission rainfall and multiple-satellite soil moisture products,
Hydrology and earth system sciences 24 (2020): 2687–2710. doi_10.5194/hess-24-2687-2020,
DOI: 10.5194%2Fhess-24-2687-2020
Abstract
Rain gauges are unevenly spaced around the world with extremely low gauge density over developing ...
Rain gauges are unevenly spaced around the world with extremely low gauge density over developing countries. For instance, in some regions in Africa the gauge density is often less than one station per 10 000 km(2). The availability of rainfall data provided by gauges is also not always guaranteed in near real time or with a timeliness suited for agricultural and water resource management applications, as gauges are also subject to malfunctions and regulations imposed by national authorities. A potential alternative is satellite-based rainfall estimates, yet comparisons with in situ data suggest they are often not optimal.
G. Margaritelli1,2 , I. Cacho2, A. Català2, M. Barra3, L. G. Bellucci4, C. Lubritto5, R. Rettori6 &
F. Lirer3, 2020, Persistent warm Mediterranean surface waters during the Roman period,
Scientific reports (Nature Publishing Group) 10 (2020). doi_10.1038/s41598-020-67281-2,
DOI: 10.1038%2Fs41598-020-67281-2
Abstract
Reconstruction of last millennia Sea Surface Temperature (SST) evolution is challenging due to the
difficulty retrieving ...
Reconstruction of last millennia Sea Surface Temperature (SST) evolution is challenging due to the
difficulty retrieving good resolution marine records and to the several uncertainties in the available
proxy tools. In this regard, the Roman Period (1 CE to 500 CE) was particularly relevant in the sociocultural
development of the Mediterranean region while its climatic characteristics remain uncertain.
Here we present a new SST reconstruction from the Sicily Channel based in Mg/Ca ratios measured
on the planktonic foraminifer Globigerinoides ruber. This new record is framed in the context of other
previously published Mediterranean SST records from the Alboran Sea, Minorca Basin and Aegean
Sea and also compared to a north Hemisphere temperature reconstruction. The most solid image that
emerges of this trans-Mediterranean comparison is the persistent regional occurrence of a distinct
warm phase during the Roman Period. This record comparison consistently shows the Roman as the
warmest period of the last 2 kyr, about 2 °C warmer than average values for the late centuries for the
Sicily and Western Mediterranean regions. After the Roman Period a general cooling trend developed
in the region with several minor oscillations. We hypothesis the potential link between this Roman
Climatic Optimum and the expansion and subsequent decline of the Roman Empire.
Pontus Lurcock1*, Fabio Florindo1,2, Sergio Bonomo3, Antonio Cascella4, Federico Di Rita5, Luciana Ferraro6, Donatella Domenica Insinga6, Donatella Magri5, Giulia Margaritelli7, Nicola Pelosi6, Paola Petrosino8, Mattia Vallefuoco6, Claudia Cosentino9 & Fabrizio Lirer6, 2020, A 4,500-year record of palaeomagnetic secular variation and relative palaeointensity from the Tyrrhenian Sea,
Geological Society, London, special publications (Online) (2020). doi_10.1144/SP497-2019-255,
DOI: 10.1144%2FSP497-2019-255
Abstract
A marine sediment core from the western Mediterranean provides a newhigh-resolution 4,500-year record of palaeomagnetic ...
A marine sediment core from the western Mediterranean provides a newhigh-resolution 4,500-year record of palaeomagnetic secular variation and relativepalaeointensity. In 2013, the 7.1-metre C5 core was recovered from the TyrrhenianSea as part of the NextData climate data project. The coring site, 15 km offshorefrom the Volturno river mouth, is well-located to record combined marine andterrestrial palaeoclimatic influences, and the fine-grained, rapidly deposited sedimentsare effective palaeomagnetic recorders. We investigate the palaeomagnetic field direction and strength recorded in the core, which provide a valuable high-resolution recordof Holocene geomagnetic variation in the area. Using rock magnetic techniques,we constrain the magnetic mineralogy of the studied sediments and confirm theirsuitability for palaeomagnetic analysis. Palaeomagnetic declination and inclinationrecords were determined by stepwise alternating-field demagnetization, and relativepalaeointensity estimates were obtained based on normalization to anhysterestic andisothermal remanent magnetization and to magnetic susceptibility. The age of the coreis well-constrained with a tephro- and biostratigraphic age model, and its magneticrecords are compared with relevant core and model data for the region, demonstratingthat our record is compatible with previous results from the area. An automated curvematching approach is applied to assess the compatibility of our data with the existingsecular variation path for the Mediterranean area.
Massimiliano Alvioli(1), Ivan Marchesini(1), Laura Melelli(2), Peter Guth(3), 2020, Geomorphometry 2020 – Conference proceedings,
P.le Aldo Moro, 7 00185 Roma_ CNR edizioni, 2020,
Abstract
Geomorphometry is the science of quantitative land surface analysis. It gathers various mathematical, statistical and ...
Geomorphometry is the science of quantitative land surface analysis. It gathers various mathematical, statistical and image processing techniques to quantify morphological, hydrological, ecological and other aspects of a land surface. Common synonyms for geomorphometry are geomorphological analysis, terrain morphometry or terrain analysis and land surface analysis. The typical input to geomorphometric analysis is a square-grid representation of the land surface_ a digital elevation (or land surface) model.
Rosa Maria Cavalli, 2020, Local, Daily, and Total Bio-Optical Models of Coastal Waters of Manfredonia Gulf Applied to Simulated Data of CHRIS, Landsat TM, MIVIS, MODIS, and PRISMA Sensors for Evaluating the Error,
Remote sensing (Basel) 12(9) (2020): 1–28. doi_10.3390/rs12091428,
DOI: 10.3390%2Frs12091428
Abstract
The spatial-temporal resolution of remote data covers coastal water variability, but this approach offers a ...
The spatial-temporal resolution of remote data covers coastal water variability, but this approach offers a lower accuracy than in situ observations. Two of the major error sources occur due to the parameterization of bio-optical models and spectral capability of the remote data. These errors were evaluated by exploiting data acquired in the coastal waters of Manfredonia Gulf. Chlorophyll-a concentrations, absorption of the colored dissolved organic material at 440 nm (aCDOM440nm), and tripton concentrations measured in situ varied between 0.09-1.76 mgm-3, 0.00-0.41 m-1, and 1.97-8.90 gm-3. In accordance with the position and time of in situ surveys, 36 local models, four daily models, and one total bio-optical model were parameterized and validated using in situ data before applying to Compact High-Resolution Imaging Spectrometer (CHRIS) mode 1, CHRIS mode 2, Landsat Thematic Mapper (TM), Multispectral Infrared and Visible Imaging Spectrometer (MIVIS), Moderate Resolution Imaging Spectroradiometer (MODIS), and Precursore Iperspettrale della Missione Applicativa (PRISMA) simulated data. Concentrations retrieved from PRISMA data using local models highlighted the smallest errors. Because tripton abundance is great and tripton absorptions were better resolved than those of chlorophyll-a and colored dissolved organic material (CDOM), tripton concentrations were adequately retrieved from all data using total models, while only local models adequately retrieved chlorophyll-a concentrations and aCDOM440nm from CHRIS mode 1, CHRIS mode 2, MIVIS, and MODIS data. Therefore, the application of local models shows smaller errors than those of daily and total models; however, the capability to resolve the absorption of water constituents and analyze their concentration range can dictate the model choice. Consequently, the integration of more models allows us to overcome the limitations of the data and sensors
Galena Jordanova (1), Stefano Luigi Gariano (2), Massimo Melillo (2), Silvia Peruccacci (2), Maria Teresa Brunetti (2), Mateja Jemec Auflic (3), 2020, Determination of Empirical Rainfall Thresholds for Shallow Landslides in Slovenia Using an Automatic Tool,
Water (Basel) 12 (2020): 1–16. doi_10.3390/w12051449,
DOI: 10.3390%2Fw12051449
Abstract
Rainfall-triggered shallow landslides represent a major threat to people and infrastructure worldwide. Predicting the possibility ...
Rainfall-triggered shallow landslides represent a major threat to people and infrastructure worldwide. Predicting the possibility of a landslide occurrence accurately means understanding the trigger mechanisms adequately. Rainfall is the main cause of slope failures in Slovenia, and rainfall thresholds are among the most-used tools to predict the possible occurrence of rainfall-triggered landslides. The recent validation of the prototype landslide early system in Slovenia highlighted the need to define new reliable rainfall thresholds. In this study, several empirical thresholds are determined using an automatic tool. The thresholds are represented by a power law curve that links the cumulated event rainfall (E, in mm) with the duration of the rainfall event (D, in h). By eliminating all subjective criteria thanks to the automated calculation, thresholds at diverse non-exceedance probabilities are defined and validated, and the uncertainties associated with their parameters are estimated. Additional thresholds are also calculated for two different environmental classifications. The first classification is based on mean annual rainfall (MAR) with the national territory divided into three classes. The area with the highest MAR has the highest thresholds, which indicates a likely adaptation of the landscape to higher amounts of rainfall. The second classification is based on four lithological units. Two-thirds of the considered landslides occur in the unit of any type of clastic sedimentary rocks, which proves an influence of the lithology on the occurrence of shallow landslides. Sedimentary rocks that are prone to weathering have the lowest thresholds, while magmatic and metamorphic rocks have the highest thresholds. Thresholds obtained for both classifications are far less reliable due to the low number of empirical points and can only be used as indicators of rainfall conditions for each of the classes. Finally, the new national thresholds for Slovenia are also compared with other regional, national, and global thresholds. The thresholds can be used to define probabilistic schemes aiming at the operative prediction of rainfall-induced shallow landslides in Slovenia, in the framework of the Slovenian prototype early warning system.
Francesco Brozzetti, 1,2
Alessandro Cesare Mondini, 3
Cristina Pauselli, 2,4
Paolo Mancinelli, 4,5
Daniele Cirillo, 1,2
Fausto Guzzetti, 3
Giusy Lavecchia, 1,2, 2020, Mainshock Anticipated by Intra-Sequence Ground Deformations_ Insights from Multiscale Field and SAR Interferometric Measurements,
Geosciences (Basel) (2020). doi_10.3390/geosciences10050186,
DOI: 10.3390%2Fgeosciences10050186
Abstract
The 2016 Central Italy seismic sequence was characterized by two main events_ 24 August, Mw ...
The 2016 Central Italy seismic sequence was characterized by two main events_ 24 August, Mw 6, and 30 October, Mw 6.5. We carried out high-resolution field sampling and DInSAR analysis of the coseismic and intra-sequence ground deformations along the Mt Vettore-Mt Bove causative fault (VBF). We found that during the intra-sequence period (24 August-30 October), the ground experienced some deformations whose final patterns seemed to be retraced and amplified by the following mainshock. We interpreted that (i) immediately after the 24 August earthquake, the deformation observed in the southern VBF expanded northwards and westwards over a Length of Deforming Ground (LDG) ranging between 28.7 and 36.3 km, and (ii) it extended to the whole portion of the hanging wall that was later affected by mainshock coseismic deformation. Assuming the LDG to be an indicator for an expected (=coseismic) surface rupture length and using known scaling functions, we obtained 6.4 <= Mw <= 6.7 for a possible incoming earthquake, which is consistent with the mainshock magnitude. We suggest that the evolution of the ground deformations after a significant seismic event might provide insights on the occurrence of new earthquakes with magnitudes comparable to or larger than the former.
Gianluca Vignaroli, Marco Mancini, Mauro Brilli, Francesco Bucci, Mauro Cardinali, Francesca Giustini, Mario Voltaggio, Tsai-Luen Yu, Chuan-Chou Shen, 2020, Spatial-temporal evolution of extensional faulting and fluid circulation in the Amatrice Basin (central Apennines, Italy) during the Pleistocene,
Frontiers in Earth Sciences (2020). doi_10.3389/feart.2020.00130,
DOI: 10.3389%2Ffeart.2020.00130
Abstract
In extensional continental settings, crustal-scale normal faults can accommodate deformation and subsidence at their hanging ...
In extensional continental settings, crustal-scale normal faults can accommodate deformation and subsidence at their hanging wall via activation and deactivation of subsidiary tectonic structures. Geological data obtained from subsidiary structures are required to infer the position of the tectonic deformation during the spatial-temporal evolution of the growth-fault system, with significant implications for structures belonging to seismogenic settings. Here, we describe a subsidiary tectonic structure (the Amatrice Fault System) accommodating Quaternary extensional deformation in the Amatrice Basin (central Apennines, Italy), which is an intermountain morpho-structural depression involved by the 2016-2017 seismic sequence. Structurally, the Amatrice Fault System defines a ~10 km-long tectonic feature running through the Amatrice Basin, and consists of NNW-SSE-striking and E-W-striking fault segments that interact and link over time. Cross-cutting fault relationships are used to reconstruct a kinematic scenario of fault growth and propagation under an ENE-WSW-directed crustal stretching, consistent with the paleostress regime governing the Quaternary activity of the central Apennines. The analysis of stable carbon and oxygen isotopes on syn-kinematic carbonate mineralizations (calcite veins and calcite fibers on fault surfaces) indicates a meteoric water circulation during the development of the growing fault structure, characterized by variable contributions of organic carbon (soil CO2), and suggesting surface rupture and hydrodynamic interconnection with the vadose zone during faulting. Geochronological U-Th dating on the same mineralizations indicates Middle-Late Pleistocene ages for tectonic activity of the Amatrice Fault System, with the younger age being 108±10 ka. Our results shed light on the long-term tectonics in the Amatrice Basin, in which the Amatrice Fault System records fault growth, hydrodynamic regime and structural permeability network developed under possible coseismic conditions during the Pleistocene. Activation and deactivation of minor tectonic structures, such as the Amatrice Fault System, can provide insights on the localization of tectonic deformation at the hanging wall of a master fault, with implication on the releasing seismogenic potential in active tectonic domains similar to the central Apennines.
Bucci, Francesco; Novellino, Rocco; Guglielmi, Paola; Tavarnelli, Enrico, 2020, Growth and dissection of a fold and thrust belt_ the geological record of the High Agri Valley, Italy,
Journal of maps 16 (2020): 245–256. doi_10.1080/17445647.2020.1737254,
DOI: 10.1080%2F17445647.2020.1737254
Abstract
We present a 130 km(2) wide geological map for the NE side of the fault-bounded ...
We present a 130 km(2) wide geological map for the NE side of the fault-bounded High Agri Valley Southern Italy, that formed in the Quaternary in response to extensional tectonics dissecting the folds and thrusts of the Lucanian Apennine. To prepare the map, at 1_25,000 scale, we integrated information obtained through field surveys and the review of pre-existing geological data. Our work describes a number of significant map-scale structures, which can be related to well-constrained tectonic episodes. The new geological map provides important constraints that can be used to distinguish ancient structures from those that were active during the Quaternary, allowing a more detailed reconstruction of the processes that operate during the development of a post-orogenic trough. We expect that the new map will be used for different types of geological investigations, including studies of inversion tectonics, active tectonics, geosite mapping, 3D modelling of geological structures.
H. Beck, N. Vergopolan, M. Pan, V. Levizzani, A. J. J. M. van Dijk, G. P. Weedon, L. Brocca, F. Pappenberger, G. J. Huffman, and E. F. Wood,, 2020, Global-Scale Evaluation of 22 Precipitation Datasets Using Gauge Observations and Hydrological Modeling,
Satellite Precipitation Measurement, edited by V. Levizzani, C. Kidd, D. B. Kirschbaum, C. D. Kummerow, K. Nakamura, F. J. Turk, pp. 625–653. Cham, Heidelberg, New York, Dordrecht, London_ Springer, 2020,
Abstract
We undertook a comprehensive evaluation of 22 gridded (quasi-)global (sub-)daily precipitation (P) datasets for the ...
We undertook a comprehensive evaluation of 22 gridded (quasi-)global (sub-)daily precipitation (P) datasets for the period 2000-2016. Thirteen non-gauge-corrected P datasets were evaluated using daily P gauge observations from 76,086 gauges worldwide. Another nine gauge-corrected datasets were evaluated using hydrological modeling, by calibrating the conceptual model HBV against streamflow records for each of 9053 small to medium-sized (<50,000 km2) catchments worldwide, and comparing the resulting performance. Marked differences in spatio-temporal patterns and accuracy were found among the datasets. Among the uncorrected P datasets, the satellite- and reanalysis-based MSWEP-ng V1.2 and V2.0 datasets generally showed the best temporal correlations with the gauge observations, followed by the reanalyses (ERA-Interim, JRA-55, and NCEP-CFSR) and the satellite- and reanalysis-based CHIRP V2.0 dataset, the estimates based primarily on passive microwave remote sensing of rainfall (CMORPH V1.0, GSMaP V5/6, and TMPA 3B42RT V7) or near-surface soil moisture (SM2RAIN-ASCAT), and finally, estimates based primarily on thermal infrared imagery (GridSat V1.0, PERSIANN, and PERSIANN-CCS). Two of the three reanalyses (ERA-Interim and JRA-55) unexpectedly obtained lower trend errors than the satellite datasets. Among the corrected P datasets, the ones directly incorporating daily gauge data (CPC Unified and MSWEP V1.2 and V2.0) generally provided the best calibration scores, although the good performance of the fully gauge-based CPC Unified is unlikely to translate to sparsely or ungauged regions. Next best results were obtained with P estimates directly incorporating temporally coarser gauge data (CHIRPS V2.0, GPCP-1DD V1.2, TMPA 3B42 V7, and WFDEI-CRU), which in turn outperformed the one indirectly incorporating gauge data through another multi-source dataset (PERSIANN-CDR V1R1). Our results highlight large differences in estimation accuracy, and hence, the importance of P dataset selection in both research and operational applications. The good performance of MSWEP emphasizes that careful data merging can exploit the complementary strengths of gauge-, satellite- and reanalysis-based P estimates.
Samia, Jalal; Temme, A. J. A. M.; Bregt, Arnold; Wallinga, Jakob; Guzzetti, Fausto; Ardizzone, Francesca, 2020, Dynamic path-dependent landslide susceptibility modelling,
Natural hazards and earth system sciences (Print) 20 (2020): 271–285. doi_10.5194/nhess-20-271-2020,
DOI: 10.5194%2Fnhess-20-271-2020
Abstract
This contribution tests the added value of including landslide path dependency in statistically based landslide ...
This contribution tests the added value of including landslide path dependency in statistically based landslide susceptibility modelling. A conventional pixel-based landslide susceptibility model was compared with a model that includes landslide path dependency and with a purely path-dependent landslide susceptibility model. To quantify path dependency among landslides, we used a space-time clustering (STC) measure derived from Ripley's space-time K function implemented on a point-based multi-temporal landslide inventory from the Collazzone study area in central Italy. We found that the values of STC obey an exponential-decay curve with a characteristic timescale of 17 years and characteristic spatial scale of 60 m. This exponential spacetime decay of the effect of a previous landslide on landslide susceptibility was used as the landslide path-dependency component of susceptibility models. We found that the performance of the conventional landslide susceptibility model improved considerably when adding the effect of landslide path dependency. In fact, even the purely path-dependent landslide susceptibility model turned out to perform better than the conventional landslide susceptibility model. The conventional plus path-dependent and path-dependent landslide susceptibility model and their resulting maps are dynamic and change over time, unlike conventional landslide susceptibility maps.
Romy Schlögel, Christian Kofler, Stefano Luigi Gariano, Jean Van Campenhout & Stephen Plummer, 2020, Changes in climate patterns and their association to natural hazard distribution in South Tyrol (Eastern Italian Alps),
Scientific reports (Nature Publishing Group) 10 (2020): 1–14. doi_10.1038/s41598-020-61615-w,
DOI: 10.1038%2Fs41598-020-61615-w
Abstract
In Alpine regions changes in seasonal climatic parameters, such as temperature, rainfall, and snow amount ...
In Alpine regions changes in seasonal climatic parameters, such as temperature, rainfall, and snow amount have already been observed. Specifically, in the South Tyrol area, meteorological observations indicate that temperatures are increasing and the number of snow days has generally diminished over time with perennial snow line now observed at higher elevations. Changes in rainfall have also been observed with more events associated with higher temperatures in the summer season. Natural hazards - mainly debris and mud flows, landslides, avalanches, rock falls, and (flash) floods - that affect this area every year, damaging population and infrastructures, are either weather or cryosphere-related. While these events have been recorded sporadically since the beginning of the 20th century, a systematic approach of their inventory has been done by local authorities since the 1990s. So far, Earth observation data has not been exploited to complete or complement existing inventories nor have they been used to investigate the influence of climate perturbation on potentially dangerous natural phenomena. The research presented here thus has three objectives_ (i) analyse long time series of climate data and hazard occurrence in South Tyrol to examine if these records exhibit a coherent response of hazards to changes in climate; (ii) measure the spatio-temporal evolution of climatic and natural hazard events recorded, and (iii) explore potential relations between meteorological conditions and the hazard occurrence. In this context, in-situ and satellite-based climate data are exploited to study natural hazard triggers while the potential of Earth observation data is evaluated as a complement to the existing historical records of natural hazards. Specifically, Copernicus Sentinel-1 images are used to detect the spatio-temporal distribution of slow earth surface deformations and the results used for checking the completeness of the actual slow-moving landslide inventories. Hazard-related changes in the South Tyrolian landscape have also been analysed in relation to particular meteorological events at a regional scale, assessing trends and anomalies. Results show that_ (i) satellite data are very useful to complement the existing natural hazard inventories; (ii) in-situ and satellite-based climate records show similar patterns but differ due to regional versus local variability; (iii) even in a data-rich region such as the analysed area, the overall response of natural hazard occurrence, magnitude, and frequency to change in climate variables is difficult to decipher due to the presence of multiple triggers and locally driven ground responses. However, an increase in the average annual duration of rainfall events and debris flow occurrence can be observed.
Massimiliano Alvioli, Fausto Guzzetti, Ivan Marchesini, 2020, Parameter-free delineation of slope units and terrain subdivision of Italy,
Geomorphology (Amst.) 358 (2020): 1–20. doi_10.1016/j.geomorph.2020.107124,
DOI: 10.1016%2Fj.geomorph.2020.107124
Abstract
Quantitative geomorphological and environmental analysis requires the adoption of well-defined spatial domains as basic mapping
units. ...
Quantitative geomorphological and environmental analysis requires the adoption of well-defined spatial domains as basic mapping
units. They provide local boundaries to aggregate environmental and morphometric variables and to perform calculations, thus they
identify the spatial scale of the analysis. Grid cells, typically aligned with a digital elevation model, are the standard mapping unit
choice. A wiser choice is represented by slope units, irregular terrain partitions delimited by drainage and divide lines that maximise
geomorphological homogeneity within each unit and geomorphological heterogeneity between neighbouring units. Adoption of
slope units has the advantage of enforcing a strong relation with the underlying topography, absent in grid cell-based analyses, but
their objective delineation is still a challenge. A given study area admits dierent slope unit maps diering in number and size
of units. Here, we devise an objective optimisation procedure for slope units, suitable for study areas of arbitrarily large size and
with varying terrain heterogeneity. We applied the new approach to the whole of Italy, resulting in a map containing about 330,000
slope unit polygons of dierent sizes and shapes. The method is parameter-free due to objective optimisation using a morphometric
segmentation function, and the map is readily available for general-purpose studies. A cluster analysis of slope units properties,
compared with terrain elevation, slope, drainage density and lithology, confirmed that the terrain partition is geomorphologically
sound. We suggest the use of the slope unit map for dierent terrain zonations, including landslide susceptibility modelling,
hydrological and erosion modelling, geo-environmental, ecological, forestry, agriculture and land use/land cover studies requiring
the identification of homogeneous terrain domains facing distinct directions.
L. Jacobs(a), M. Kervyn(b), P. Reichenbach(c), M. Rossi(c), I. Marchesini(c), M. Alvioli(c), O. Dewitte(d), 2020, Regional susceptibility assessments with heterogeneous landslide information_ Slope unit- vs. pixel-based approach,
Geomorphology (Amst.) 356 (2020): 1–20. doi_10.1016/j.geomorph.2020.107084,
DOI: 10.1016%2Fj.geomorph.2020.107084
Abstract
Regional landslide inventories are often prepared by several different experts, using a variety of data ...
Regional landslide inventories are often prepared by several different experts, using a variety of data sources. This can result in a combination of polygon and point landslide data, characterized by different meanings, uncertainties and levels of reliability. The propagation of uncertainties due to such heterogeneous data is a relevant issue in statistical landslide susceptibility zonation at supra-local scale. In the inhabited highlands of the Rwenzori Mountains, we compare different approaches and mapping units to provide a robust methodology for susceptibility mapping using a combination of landslide point and polygon data. First, the effect of the uncertainty related to a point representation of landslides is assessed comparing slope unit-based and pixel-based analyses, using digital elevation models with different resolutions. Secondly, with regard to landslide polygon inventories, we compare the use of thresholds versus a presence/absence of the depletion centroid or a randomly selected point in the landslide polygon in order to identify slope units with landslides. Based on these results, we prepare regional slope unit-based susceptibility maps using a logistic regression model calibrated with the landslide polygon inventory and validated with the point inventory. Although pixel-based mapping remains the most common approach for statistical landslide susceptibility zonation, our analysis clearly favours the use of slope units as a powerful tool to prepare regional susceptibility maps and, in particular, to exploit heterogeneous information in a consistent way.
Pellarin, T., Román-Cascón, C., Baron, C., Bindlish, R., Brocca, L., Camberlin, P., Fernandez-Prieto, D., Kerr, Y.H., Massari, C., Panthou, G., Philippon, N., Quantin, G., 2020, The Precipitation Inferred from Soil Moisture (PrISM) near Real-Time Rainfall Product_ Evaluation and Comparison,
Remote sensing (Basel) (2020). doi_10.3390/rs12030481,
DOI: 10.3390%2Frs12030481
Abstract
Near real-time precipitation is essential to many applications. In Africa, the lack of dense rain-gauge ...
Near real-time precipitation is essential to many applications. In Africa, the lack of dense rain-gauge networks and ground weather radars makes the use of satellite precipitation products unavoidable. Despite major progresses in estimating precipitation rate from remote sensing measurements over the past decades, satellite precipitation products still suffer from quantitative uncertainties and biases compared to ground data. Consequently, almost all precipitation products are provided in two modes_ a real-time mode (also called early-run or raw product) and a corrected mode (also called final-run, adjusted or post-processed product) in which ground precipitation measurements are integrated in algorithms to correct for bias, generally at a monthly timescale. This paper describes a new methodology to provide a near-real-time precipitation product based on satellite precipitation and soil moisture measurements. Recent studies have shown that soil moisture intrinsically contains information on past precipitation and can be used to correct precipitation uncertainties. The PrISM (Precipitation inferred from Soil Moisture) methodology is presented and its performance is assessed for five in situ rainfall measurement networks located in Africa in semi-arid to wet areas_ Niger, Benin, Burkina Faso, Central Africa, and East Africa. Results show that the use of SMOS (Soil Moisture and Ocean Salinity) satellite soil moisture measurements in the PrISM algorithm most often improves the real-time satellite precipitation products, and provides results comparable to existing adjusted products, such as TRMM (Tropical Rainfall Measuring Mission), GPCC (Global Precipitation Climatology Centre) and IMERG (Integrated Multi-satellitE Retrievals for GPM), which are available a few weeks or months after their detection.
Modanesi, S., Massari, C., Camici, S., Brocca, L., Amarnath, G., 2020, Do satellite surface soil moisture observations better retain information about crop-yield variability in drought conditions?,
Advances in water resources (2020). doi_10.1029/2019WR025855,
DOI: 10.1029%2F2019WR025855
Abstract
Soil moisture is a highly suitable indicator for assessing agricultural drought, as plants start to ...
Soil moisture is a highly suitable indicator for assessing agricultural drought, as plants start to wilt when there is not sufficient soil water to meet evapotranspiration demand. In this study, we provide insights on information obtained from satellite surface soil moisture observations (as compared to modelled soil moisture and observed ground precipitation) on water stress and its impact on crop production variability in India. The analysis involved generating a Standardized Soil Moisture Index (SSI) using 1) satellite soil moisture observations from the European Space Agency (ESA) Climate Change Initiative (CCI); and 2) the Modern-Era Retrospective Analysis for Research and Applications, version 2 (MERRA-2) soil moisture dataset; as well as producing a Standardized Precipitation Index (SPI) using ground-based rainfall observations from the Indian Meteorological Department (IMD). Spanning the period from 1998 to 2015, the study covers Maharashtra and Karnataka states. These states were recently hit by a severe drought, resulting in significant crop failure and human losses. Results show that soil moisture is an important limiting factor for crop production. As such, it is more suitable for representing agricultural drought than precipitation during drought conditions, as it correlates more closely with reduced crop yields. Additionally, using the satellite-based SSI seemed to explain crop yield reductions better than when we applied the model-based SSI from MERRA-2, particularly for irrigated crops (i.e., wheat). This preliminary study can underpin future crop-forecasting tools assimilating satellite soil moisture data. In practice, satellite soil moisture may help to improve the efficiency of agricultural and irrigation management practices.
Beccari, Giovanni; Prodi, Antonio; Senatore, Maria Teresa; Balmas, Virgilio; Tini, Francesco; Onofri, Andrea; Pedini, Luca; Sulyok, Michael; Brocca, Luca; Covarelli, Lorenzo, 2020, Cultivation area affects the presence of fungal communities and secondary metabolites in Italian durum wheat grains,
Toxins (Basel) 12 (2020). doi_10.3390/toxins12020097,
DOI: 10.3390%2Ftoxins12020097
Abstract
In this study, durum wheat kernels harvested in three climatically different Italian cultivation areas (Emilia ...
In this study, durum wheat kernels harvested in three climatically different Italian cultivation areas (Emilia Romagna, Umbria and Sardinia) in 2015, were analyzed with a combination of different isolation methods to determine their fungal communities, with a focus on Fusarium head blight (FHB) complex composition, and to detect fungal secondary metabolites in the grains. The genus Alternaria was the main component of durum wheat mycobiota in all investigated regions, with the Central Italian cultivation area showing the highest incidence of this fungal genus and of its secondary metabolites. Fusarium was the second most prevalent genus of the fungal community in all cultivation environments, even if regional differences in species composition were detected. In particular, Northern areas showed the highest Fusarium incidence, followed by Central and then Southern cultivation areas. Focusing on the FHB complex, a predominance of Fusarium poae, in particular in Northern and Central cultivation areas, was found. Fusarium graminearum, in the analyzed year, was mainly detected in Emilia Romagna. Because of the highest Fusarium incidence, durum wheat harvested in the Northern cultivation area showed the highest presence of Fusarium secondary metabolites. These results show that durum wheat cultivated in Northern Italy may be subject to a higher FHB infection risk and to Fusarium mycotoxins accumulation.
Filippucci, Paolo; Tarpanelli, Angelica; Massari, Christian; Serafini, Andrea; Strati, Virginia; Alberi, Matteo; Raptis, Kassandra Giulia Cristina; Mantovani, Fabio; Brocca, Luca, 2020, Soil moisture as a potential variable for tracking and quantifying irrigation_ A case study with proximal gamma-ray spectroscopy data,
Advances in water resources 136 (2020). doi_10.1016/j.advwatres.2019.103502,
DOI: 10.1016%2Fj.advwatres.2019.103502
Abstract
The global warming effects put in danger global water availability and make necessary to decrease ...
The global warming effects put in danger global water availability and make necessary to decrease water wastage, e.g., by monitoring global irrigation. Despite this, global irrigation information is scarce due to the absence of a solid estimation technique. In this study, we applied an innovative approach to retrieve irrigation water from high spatial and temporal resolution Soil Moisture (SM) data obtained from an advanced sensor based on Proximal Gamma-Ray (PGR) spectroscopy, in a field located in Emilia Romagna (Italy). The results show that SM is a key variable to obtain information about the amount of water applied to plants, with Pearson correlation between observed and estimated daily irrigation data ranges from 0.88 to 0.91 by using different calibration methodology. With the aim of reproducing the working conditions of satellites measuring soil moisture, we sub-sampled SM hourly time series at larger time steps. The results demonstrated that the methodology is still capable to perform the daily (weekly) irrigation estimation with Pearson Correlation around 0.6 (0.7) if the time step is not greater than 36 (48) hours.
M. Santangelo(1), I. Marchesini(1), F. Bucci(1), M. Cardinali(1), M. Cavalli(2), S. Crema(2), L. Marchi(2), M. Alvioli(1), F. Guzzetti(1), 2020, Exposure to landslides in rural areas in Central Italy,
Journal of maps (Stud. ed.) (2020): 1–35.,
Abstract
Starting on 24th August 2016, Central Italy was struck by a six-months earthquake sequence that ...
Starting on 24th August 2016, Central Italy was struck by a six-months earthquake sequence that caused 303 victims and extensive major damages to urban areas and infrastructures, in some cases entire villages needed complete rebuilding. In this paper we present a map that portrays the overall susceptibility to multiple landslide types and the exposure to landslides of the rural-urban areas of the Castelsantangelo sul Nera Municipality, a typical village of the northern Italian Apennine. The map is based on a procedure that ingests geomorphological data and models and groups the individual landslide susceptibility maps in a joint susceptibility and exposure map based on
expert-defined criteria. The procedure has been applied to built-up and to undeveloped areas to highlight their exposure and was used as a tool for planning post-seismic reconstruction. We advise that such maps are used also as basic tool for ordinary urban planning.
Martina Cignetti, Diego Guenzi, Francesca Ardizzone, Paolo Allasia, Daniele Giordan, 2020, An Open-Source Web Platform to Share Multisource, Multisensor Geospatial Data and Measurements of Ground Deformation in Mountain Areas,
ISPRS international journal of geo-information 9 (2020). doi_10.3390/ijgi9010004,
DOI: 10.3390%2Fijgi9010004
Abstract
Nowadays, the increasing demand to collect, manage and share archives of data supporting geo-hydrological processes ...
Nowadays, the increasing demand to collect, manage and share archives of data supporting geo-hydrological processes investigations requires the development of spatial data infrastructure able to store geospatial data and ground deformation measurements, also considering multisource and heterogeneous data. We exploited the GeoNetwork open-source software to simultaneously organize in-situ measurements and radar sensor observations, collected in the framework of the HAMMER project study areas, all located in high mountain regions distributed in the Alpines, Apennines, Pyrenees and Andes mountain chains, mainly focusing on active landslides. Taking advantage of this free and internationally recognized platform based on standard protocols, we present a valuable instrument to manage data and metadata, both in-situ surface measurements, typically acquired at local scale for short periods (e.g., during emergency), and satellite observations, usually exploited for regional scale analysis of surface displacement. Using a dedicated web-interface, all the results derived by instrumental acquisitions and by processing of remote sensing images can be queried, analyzed and downloaded from both expert users and stakeholders. This leads to a useful instrument able to share various information within the scientific community, including the opportunity of reprocessing the raw data for other purposes and in other contexts.
Afshin Shayeghi, Asghar Azizian, Luca Brocca, 2020, Reliability of reanalysis and remotely sensed precipitation products for hydrological simulation over the Sefidrood River Basin, Iran,
Hydrological sciences journal (2020). doi_10.1080/02626667.2019.1691217,
DOI: 10.1080%2F02626667.2019.1691217
Abstract
Hydrological models require different inputs for the simulation of processes, among which precipitation is essential. ...
Hydrological models require different inputs for the simulation of processes, among which precipitation is essential. For hydrological simulation, four different precipitation products - Asian Precipitation Highly Resolved Observational Data Integration Towards Evaluation of Water Resources (APHRODITE); European Centre for Medium-Range Weather Forecasts (ECMWF) Re-Analysis (ERA-Interim); Tropical Rainfall Measuring Mission (TRMM) Multi-satellite Precipitation Analysis (TMPA) real time (RT); and Precipitation Estimation from Remotely Sensed Information using Artificial Neural Networks (PERSIANN) - are compared against ground-based datasets. The variable infiltration capacity (VIC) model was calibrated for the Sefidrood River Basin (SRB), Iran. APHRODITE and ERA-Interim gave better rainfall estimates at daily time scale than other products, with Nash-Sutcliffe efficiency (NSE) values of 0.79 and 0.63, and correlation coefficient (CC) of 0.91 and 0.82, respectively. At the monthly time scale, the CC between all rainfall datasets and ground observations is greater than 0.9, except for TMPA-RT. Hydrological assessment indicates that PERSIANN is the best rainfall dataset for capturing the streamflow and peak flows for the studied area (CC: 0.91, NSE_ 0.80).
Alessio Cislaghi, Daniele Masseroni, Christian Massari, Stefania Camici, Luca Brocca, 2020, Combining a rainfall-runoff model and a regionalization approach for flood and water resource assessment in the western Po Valley, Italy,
Hydrological sciences journal (2020). doi_10.1080/02626667.2019.1690656,
DOI: 10.1080%2F02626667.2019.1690656
Abstract
Selecting the best structure and parameterization of rainfall-runoff models is not straightforward and depends on ...
Selecting the best structure and parameterization of rainfall-runoff models is not straightforward and depends on a broad number of factors. In this study, the "Modello Idrologico Semi-Distribuito in continuo" (MISDc) was tested on 63 mountainous catchments in the western Po Valley (Italy) and the optimal model parameters were regionalized using different strategies. The model performance was evaluated through several indexes analysing hydrological regime, high-flow condition and flow-duration curve (FDC). In general, MISDc provides a good fit behaviour with a Kling-Gupta Efficiency index greater than 0.5 for 100% and 84% of cases for calibration and validation respectively. Concerning the regionalization, spatial proximity approach is the most accurate solution obtaining satisfactory performance. Lastly, the predicted FDCs showed an excellent similarity with the observed ones. Results encourage to apply MISDc over the study area for flood forecasting and for assessing water resources availability thanks to the modest computational efforts and data requirements.
Song, S., Brocca, L., Wang, W., Cui, W., 2020, Testing the potential of soil moisture observations to estimate rainfall in a soil tank experiment,
Journal of hydrology (Amst.) (2020). doi_10.1016/j.jhydrol.2019.124368,
DOI: 10.1016%2Fj.jhydrol.2019.124368
Abstract
An experimental loamy sand soil tank (12m long × 1.5m wide × 1.5m deep) with ...
An experimental loamy sand soil tank (12m long × 1.5m wide × 1.5m deep) with a slope of 3 ° was designed to conduct artificial rainfall-runoff experiments and continuously monitor soil moisture (SM), rainfall, surface runoff (SR) and subsurface runoff (SSR). A total of 28 rainfall-runoff events are analysed to investigate the capability of estimating rainfall from SM observations through SM2RAIN algorithm which is then adjusted in SM2RAIN-exp according to the conditions of the artificial rainfall-runoff experiment, i.e., including the SR and SSR component. The main purpose of this study is to test the underlying hypotheses of SM2RAIN algorithm in a controlled experiment to better understand the most important processes driving the relationship between SM and rainfall.
Results suggest that SM2RAIN-exp demonstrates satisfactory performance in estimating rainfall with respect to the observed data. When the aggregation intervals of rainfall increase, the SM2RAIN-exp performances improve. The integration of 10cm and 30cm SM data yields performance scores better than using the sensor at 10cm and 30cm depth alone. The lagged response of 30cm SM sensor has a slight influence on the results. In addition, the major contribution to the estimated rainfall is provided by the term incorporating the SM variations (~85%), followed by the SR (12%), which is different from the hypothesis of neglecting SR made in the classical SM2RAIN. By comparing the results obtained by SM2RAIN and SM2RAIN-exp, SM2RAIN-exp is proved more stable and accurate. The recognition of the more suitable soil depth needed for obtaining good results, and of the important SR contribution, could help to clarify some important aspects related to the usage of satellite surface SM data for estimating rainfall.
Azizian, Asghar; Brocca, Luca, 2020, Determining the best remotely sensed DEM for flood inundation mapping in data sparse regions,
International journal of remote sensing (Print) (2020). doi_10.1080/01431161.2019.1677968,
DOI: 10.1080%2F01431161.2019.1677968
Abstract
One of the most essential inputs in flood inundation mapping is the geometric description of ...
One of the most essential inputs in flood inundation mapping is the geometric description of the floodplains and river channel that often derives from the digital elevation models (DEMs). By increasing the satellite-based technologies during the past 30 years, several DEM sources ranging from fine-resolution and accurate, but costly, to low-cost and low-resolution have been developed. In most parts of the world, especially developing countries and data sparse regions, the coarse resolution DEMs is the only available data set for hydraulic modelling and flood inundation mapping. This research addressed the usefulness and efficiency of the recently released Advanced Land Observing Satellite (ALOS) DEM in flood inundation mapping using 1D Hydrologic Engineering Centre- River Analysis System (HEC-RAS) model. In addition, other DEM sources such as Shuttle Radar Topography Mission (SRTM-90 m), SRTM-30 m, and Advanced Spaceborne Thermal Emission and Reflection Radiometer (ASTER-30 m) are used to carry out a comprehensive evaluation of remotely sensed DEMs for flood inundation mapping. Findings indicate that using ALOS-30m for hydraulic simulation approximately leads to the similar results as well as ground-based DEM (GDEM). For example, the Mean Absolute Percentage Error (MAPE) in simulating mean Water Surface Elevation (WSE) and mean inundated extents based on this dataset, within the cross-sections, is lower than 8% and 13% for SojasRood river, respectively, while for Sarbaz river these values are 9% and 2%. Moreover, in both rivers, SRTM-30 m relative to ASTER-30 m and SRTM-90 m DEMs presents better results in deriving the geometric model and hydraulic simulation. Also, Hydraulic modelling based on ASTER-30 m, even relative to SRTM-90 m as a coarser resolution DEM, shows a significant discrepancy compared to GDEM. Moreover, in both rivers, the MAPE in predicting inundated extents, within the reaches, is higher than 38%.
J. Hammelmann (1,2), A. Soto-Ontoso (3), M. Alvioli (4,5), H. Elfner (1,2,6), M. Strikman (7), 2020, Influence of the neutron-skin effect on nuclear isobar collisions at RHIC,
Physical review. C. Nuclear physics (Print) 101 (2020): 061901(R). doi_10.1103/PhysRevC.101.061901,
DOI: 10.1103%2FPhysRevC.101.061901
Abstract
The unambiguous observation of a Chiral Magnetic Effect (CME)-driven charge separation is the core aim ...
The unambiguous observation of a Chiral Magnetic Effect (CME)-driven charge separation is the core aim of the isobar program at RHIC consisting of 96,40Zr+96,40Zr and 96,44Ru+96,44Ru collisions at sqrt sNN = 200 GeV. We quantify the role of the spatial distributions of the nucleons in the isobars on both eccentricity and magnetic field strength within a relativistic hadronic transport approach (SMASH, Simulating Many Accelerated Strongly-interacting Hadrons). In particular, we introduce isospin-dependent nucleon-nucleon spatial correlations in the geometric description of both nuclei, deformation for 96,44Ru and the so-called neutron skin effect for the neutron-rich isobar i.e. 96,40Zr. The main result of this study is a reduction of the magnetic field strength difference between 96,44Ru+96,44Ru and 96,40Zr+96,40Zr by a factor of 2, from 10% to 5% in peripheral collisions when the neutron-skin effect is included. Further, we find an increase of the eccentricity ratio between the isobars by up to 10% in ultra-central collisions as due to the deformation of 96,44Ru while neither the neutron skin effect nor the nucleon-nucleon correlations result into a significant modification of this observable with respect to the traditional Woods-Saxon modeling. Our results suggest a significantly smaller CME signal to background ratio for the experimental charge separation measurement in peripheral collisions with the isobar systems than previously expected.
G. Vignaroli, M. Mancini, F. Bucci, M. Cardinali, G.P. Cavinato, M. Moscatelli, M.L. Putignano, P. Sirianni, M. Santangelo, F. Ardizzone, G. Cosentino, C. Di Salvo, F. Fiorucci, I. Gaudiosi, S. Giallini, P. Messina, E. Peronace, F. Polpetta, P. Reichenbach, V. Scionti, M. Simionato, F. Stigliano, 2019, Geology of the central part of the Amatrice Basin (Central Apennines, Italy),
Journal of maps (2019). doi_10.1080/17445647.2019.1570877,
DOI: 10.1080%2F17445647.2019.1570877
Abstract
A 1_5,000 scale geological map and 31 geological cross-sections are presented for the surroundings of ...
A 1_5,000 scale geological map and 31 geological cross-sections are presented for the surroundings of Amatrice village (central Apennines, Italy), epicentral area of the first damaging earthquake of the 2016-2017 seismic sequence. This detailed geological dataset focuses on_ (i) the extent, the thickness, and the internal stratigraphic architecture of the Quaternary continental deposits; (ii) the bedding and the thickness of the Miocene substratum; and (iii) the spatial distribution of the main fault systems. The provided dataset would update the available regional geological maps in deciphering the syn-to-post-orogenic history of the Amatrice Basin. Eventually, the accuracy of the geological mapping would represent a basic tool for interpreting and integrating the multidisciplinary dataset deriving from post-seismic activities.