Francesca Ardizzone (1), Alessandro Mondini (1), Federica Fiorucci (1), Vassilis Sakkas (2), Natalia Spanou (3), Salvatore Stramondo (4), Christian Bignami (4), Marco Polcari (4), Matteo Albano (4), Fifamè Koudogbo (5), Maite Garcia (5), 2015, Progetto MEMPHIS.D1.1_v1: Assessment of User Requirements,
pp.1–25, 2015,
Abstract
This report represents the draft version deliverable 1.1 according to the contract No 4000113774/15/CNR-IRPI (Appendix ...
This report represents the draft version deliverable 1.1 according to the contract No 4000113774/15/CNR-IRPI (Appendix B to the Statement of Work, Project deliverable list). The report summarises the User Requirements that have been collected and considered for the definition of the products to be developed in the framework of the Geohazards GSP (General Studies Programme). The European Space Agency (ESA) and the Group on Earth Observations (GEO) have worked together for several years on the specific topic of disasters and share, in particular, a deep interest in geohazards. This became more evident with the joint collaboration to host the International Forum on Satellite Earth Observations for Geohazards (the Santorini Conference) from 21-23 May, 2012 in Santorini, Greece. The document first considers the user requirements that have been gathered in Bally, 2012 and CEOS, 2015. Those first set of requirements is completed by the specifications defined within the project consortium, by the advanced and expert users CNR-IRPI, INGV, IGME and NKUA. The User Consultation Workshop was moreover organised on November 27th with the objective of collecting the requirements of the Disaster Risk Reduction (DRR) user community regarding the use of new EO methods and Information and communications technology (ICT).
Alessandro Mondini
Angelica Tarpanelli
Mauro Rossi
Claudia Notarnicola
Carlo Manin
Ruth Sonnenshein
Pablo Blanco, 2015, Commons (ESA-SEOM Project) D1.2: Algorithm Theoretical Basis Document (ATBD),
2015,
Abstract
This document represents the Algorithm Theoretical Basis Document (ATBD), output result of WP1300 "Implementation Strategy" ...
This document represents the Algorithm Theoretical Basis Document (ATBD), output result of WP1300 "Implementation Strategy"
Maccioni, Pamela; Kossida, Maggie; Brocca, Luca, 2015, Assessment of the Drought Hazard in the Tiber River Basin in Central Italy and a Comparison of New and Commonly Used Meteorological Indicators (vol 20, 05014029, 2015),
Journal of hydrologic engineering 20 (2015). doi_10.1061/(ASCE)HE.1943-5584.0001155,
DOI: 10.1061%2F(ASCE)HE.1943-5584.0001155
Abstract
Drought is one of the most common natural hazards with adverse effects on agriculture and ...
Drought is one of the most common natural hazards with adverse effects on agriculture and the water resources. This study aims to
spatially analyze the drought hazard in the Upper Tiber River basin and find a representative indicator on the basis of meteorological data that
are widely available. To this end, the significance of using solely precipitation versus including evapotranspiration (ET) in drought
characterization is thoroughly investigated. Three relevant indicators are considered_ (1) a new index Standardized Effective Precipitation
EvapoTranspiration Index (SPETI) incorporating, besides ET, the losses due to runoff; (2) the commonly used Standardized Precipitation
Index (SPI); and (3) the Reconnaissance Drought Index (RDI). A comparison is undertaken at various timescales (9, 12, and 24 months) using
precipitation and temperature data from two stations for the period 1953-2011, for which complete rainfall and temperature time series are
available. This analysis demonstrates (1) the very similar evolution and behavior of the three indexes and (2) the reliability of the SPI for
drought monitoring and characterization in the case of the Upper Tiber River basin, also using observed hydrological effects. Based on these
findings, a longer data set of available precipitation data (45 stations, 96-year-long time series from 1916 to 2011) is used to calculate the
SPI12 and to derive four new subindicators reflecting the intensity, magnitude, duration, and frequency of drought events. These subindicators,
once classified, are blended into a Drought Hazard Index (DHI), thus providing a more holistic characterization of the drought hazard on a
scale of 1 to 4. A spatial analysis is finally performed across the resulting DHI values in order to investigate the spatial variability of a drought
hazard and identify drought-prone areas. It is found that the most vulnerable areas are located in the southern and eastern part of the Upper
Tiber River basin, and the north-central part is less affected by drought conditions.
Gao, Xiaodong; Gao, Xiaodong; Zhao, Xining; Zhao, Xining; Si, Bing Cheng; Si, Bing Cheng; Brocca, Luca; Hu, Wei; Wu, Pute; Wu, Pute, 2015, Catchment-scale variability of absolute versus temporal anomaly soil moisture_ Time-invariant part not always plays the leading role,
Journal of hydrology (Amst.) 529 (2015): 1669–1678. doi_10.1016/j.jhydrol.2015.08.020,
DOI: 10.1016%2Fj.jhydrol.2015.08.020
Abstract
[object Object] ...
[object Object]
Santi, E.; Paloscia, S.; Pettinato, S.; Brocca, L.; Ciabatta, L., 2015, Robust assessment of an operational algorithm for the retrieval of soil moisture from AMSR-E data in central Italy,
IGARSS 2015, pp. 1288–1291, 2015,
Abstract
In this work, the surface soil moisture (SMC) derived from the AMSR-E acquisitions by using ...
In this work, the surface soil moisture (SMC) derived from the AMSR-E acquisitions by using Artificial Neural Networks (ANN) is compared with simulated data obtained from the application of a soil water balance model in central Italy. All the overpasses available for the 9-years lifetime of AMSR-E have been considered for the comparison, which was carried out point by point over a grid of 91 nodes spaced at 0.1×0.1°, roughly corresponding to the Umbria region. The main purpose of this study is to exploit the potential of AMSR-E sensors for hydrological studies, and in particular, for SMC monitoring at regional scale in heterogeneous environments.
Todisco, F.; Brocca, L.; Termite, L. F.; Wagner, W., 2015, Use of satellite and modeled soil moisture data for predicting event soil loss at plot scale,
Hydrology and earth system sciences 19 (2015): 3845–3856. doi_10.5194/hess-19-3845-2015,
DOI: 10.5194%2Fhess-19-3845-2015
Abstract
[object Object] ...
[object Object]
Paolo Allasia, Francesca Ardizzone, Martina Cignetti, Daniele Giordan, Andrea Manconi, Michele Manunta, 2015, HAMMER-Deliverable 3 e 4_ WP1-WP2. Collected and Processed Data List,
2015,
Abstract
The deliverable 3 is represented by the new DInSAR ground deformation map and associated time ...
The deliverable 3 is represented by the new DInSAR ground deformation map and associated time series
realized by the CNR-IREA.
Salvati P, Bianchi C., Fiorucci F., Marchesini I., Rossi M., Guzzetti F, 2015, Flood risk to the population and its temporal variation in Italy,
Advanced in Watershed Hydrology, pp. 433–456. Highland Ranch, Colorado_ Water Resources Publications, LLC, 2015,
Abstract
Floods pose a severe threat to the population of Italy. Quantitative flood risk levels to ...
Floods pose a severe threat to the population of Italy. Quantitative flood risk levels to the population can be evaluated determining levels of individual risk. Using an updated version of an historical record of flood events with human consequences in Italy, we studied the temporal and the geographical distributions of events with casualties in the 1861 - 2013 period, and we determined individual flood risk for the whole Italy, and for five physiographical areas established classifying the Italian municipalities on their terrain elevation and the distance to the sea coast. To study individual flood risk, we determined flood mortality rates using Italian census data from 1861. To evaluate the temporal variation of flood mortality, we divided the historical record into three 50-year periods, and we calculated the average flood mortality for the periods, and their variations in the different physiographical zones. The results were compared to risk levels calculated for landslides, earthquakes, and volcanic activities, and with the perception that the population of Italy has of the risk posed by different natural hazards. The comparison revealed that the perception of the threat does not match the long-term risk posed to the population by floods, and by the other natural hazards.
Marco Scaioni (a), Vasil Yordanov (a), Raffaella Brumana (a)
Maria Teresa Brunetti (b), Maria Teresa Melis (c), Zhizhong Kang (d), Angelo Zinzi (e), 2015, Studio dei fenomeni di dissesto geologico sulla superficie lunare a partire dai dati telerilevati dai satelliti Chang’E 1 e 2,
ASITA, pp. 917–918, Lecco, 29-30 settembre 1 ottobre 2015,
Abstract
L'esplorazione della Luna si sta avviando verso una fase in cui la pura indagine scientifica ...
L'esplorazione della Luna si sta avviando verso una fase in cui la pura indagine scientifica sarà
affiancata dal tentativo di individuare e sfruttare le risorse minerarie ivi presenti. Numerose nazioni
hanno già investito importanti risorse in questa direzione. Oltre a quelle che tradizionalmente sono
state impegnate in programmi di esplorazione lunare (Stati Uniti e Confederazione Russa/ex-
Unione Sovietica), alcuni paesi emergenti dal punto di vista economico (Cina R.P., India,
Giappone) hanno già organizzato o stanno pianificando nuove missioni. Le missioni attuali sono
finalizzate all'acquisizione di dati telerilevati tramite satelliti per (i) la mappatura plano-altimetrica
della superficie topografica, (ii) la caratterizzazione mineralogica e petrografica e la composizione
chimica del suolo, (iii) la mappatura termica, oltre che per (iv) la misurazione di una serie di
parametri fisici necessari per specifiche indagini di tipo astrofisico. Oltre a ciò alcune delle missioni
hanno come obiettivo l'allunaggio di veicoli a navigazione autonoma o di astronauti, i quali
ovviamente rivestono un ruolo determinante per lo studio del potenziale sfruttamento di risorse.
In questa direzione, la ricerca di fenomeni di dissesto geologico sulla superficie lunare richiede una
particolare attenzione. Sapere dove sono già avvenuti fenomeni di dissesto è importante per studiare
le correlazioni con le caratteristiche geomorfologiche del suolo lunare, unitamente ad altri possibili
fattori che ne possono favorire o innescare l'occorrenza. La conoscenza di queste relazioni può essere utilizzata per valutare la suscettibilità alle frane, e quindi localizzare quelle aree dove è
sconsigliato l'allunaggio o la costruzione di insediamenti stabili. La presenza di aree già interessate
da frane può anche essere interessante per la ricerca di minerali presenti nel sottosuolo, che in
queste zone potrebbero avere affioramenti in superficie.
Nell'ambito del progetto di ricerca bilaterale tra l'Italia e la Repubblica della Cina Popolare
denominato "Moon Mapping", i ricercatori dei gruppi partecipanti hanno la possibilità di utilizzare i
dati acquisiti dai satelliti cinesi della serie Chang'E. Questi satelliti sono equipaggiati con diversi
sensori, tra i quali un altimetro laser e alcune camere per l'acquisizione di immagini multispettrali.
A partire da questi dati sono state realizzate alcune coperture complete di ortoimmagini e un
modello digitale della superficie lunare. L'Agenzia Spaziale Italiana (ASI) si occupa di coordinare
il progetto dal lato italiano.
All'interno del progetto "Moon Mapping" un gruppo di lavoro si occupa dello studio delle frane
all'interno dei crateri di impatto. Allo stato attuale della ricerca, alcune immagini WAC (Wide
Angle Camera) e un modello digitale del terreno (DEM) provenienti dalla missione LROC della
NASA (risoluzione al suolo 100 m/pixel) sono stati utilizzati per individuare le frane sulla base di
un'ispezione visiva. I criteri proposti in Brunetti et al. (2014) sono stati applicati per compilare un
catalogo dei fenomeni franosi all'interno dei crateri. I passi successivi di questo studio dovrebbero
essere costituiti da_ (i) la classificazione dei crateri di impatto sulla base della forma della cavità, del
bordo e della dimensione (secondo quanto proposto in letteratura e in particolare in Melosh, 1989);
(ii) l'identificazione per ciascun tipo di cratere della forma teorica che dovrebbe assumere in
assenza di fenomeni di dissesto al suo interno (tramite modellazione 3D o attraverso una serie di
sezioni trasversali); (iii) la classificazione dei crateri attraverso l'analisi delle differenze rispetto alla
forma teorica; (iv) la misura del volume del materiale movimentato a seguito delle frane; (v)
l'analisi delle relazioni tra le frane e le caratteristiche morfometriche dei crateri che le contengono
(pendenza, profondità, ecc.) e del terreno circostante (pendenza topografica, geologia,
geomorfologia, ecc.); (vi) confronto dei dati multispettrali rispetto alle librerie spettrali disponibili
per la mappatura geomorfologici dei caratteri mineralogici sulla superficie della Luna. Saranno
inoltre testati algoritmi di classificazione automatica delle forme basati sull'utilizzo di DEM e
proposti da Melis et al. 2014 per il riconoscimento automatico e semiautomatico di morfologie
vulcaniche legate ai coni di scorie e di possibile applicazione all'ambito di interesse di questo
studio.
Al fine di poter analizzare questi aspetti si intende utilizzare i dati delle missioni cinesi Chang'E 2,
la cui risoluzione è superiore a quella dei dati messi attualmente disponibili per la missione LROC
della NASA.
Bibliografia
Brunetti, M.T., Xiao, Z., Komatsu, G., Peruccacci, S., Guzzetti, F., 2015. Large rockslides in impact
craters on the Moon and Mercury. Icarus, 260_ 289-300. Doi_10.1016/j.icarus.2015.07.014.
Melis, M. T., Mundula, F., DessÌ, F., Cioni, R., and Funedda, A.: Tracing the boundaries of
Cenozoic volcanic edifices from Sardinia (Italy): a geomorphometric contribution, Earth Surf.
Dynam., 2, 481-492, doi_10.5194/esurf-2-481-2014, 2014
Melosh, H.J., 1989. Impact Cratering_ A Geologic Process. Oxford University Press, New York, pp.
245.
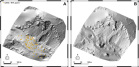
M. T. Brunetti (1), Z. Xiao (2,3), G. Komatsu (4), S. Peruccacci (1) and F. Guzzetti (1), 2015, Terrestrial and extraterrestrial landslide size statistics,
European Planetary Science Congress 2015, Nantes, 27 September - 2 October 2015,
Abstract
We present the size statistics of landslides on Earth, Mars, the Moon and Mercury. We ...
We present the size statistics of landslides on Earth, Mars, the Moon and Mercury. We used two existing landslide inventories for New Mexico (USA) and for Valles Marineris, Mars, and two new inventories of lunar and Mercurian landslides. Failures on the Moon and Mercury were detected and mapped along the internal walls of impact craters. The statistical distributions of the extraterrestrial landslide area were exploited to compare the results with similar distributions obtained for terrestrial landslides.
M. T. Brunetti (1), Z. Xiao (2,3), G. Komatsu (4), S. Peruccacci (1), and F. Guzzetti (1), 2015, Large landslides in lunar and mercurian impact craters,
46th Lunar and Planetary Science Conference, The Woodlands, Texas, 16-20, March 2015,
Abstract
The contribution describes the recognition and mapping of large rock slides in impact craters on ...
The contribution describes the recognition and mapping of large rock slides in impact craters on the Moon and Mercury.
Massimo Melillo, Maria Teresa Brunetti, Stefano Luigi Gariano, Silvia Peruccacci, Fausto Guzzetti, 2015, AUTOMATIC RECONSTRUCTION OF RAINFALL EVENTS AND OBJECTIVE DEFINITION OF RAINFALL THRESHOLDS FOR LANDSLIDE OCCURRENCE,
Le Giornate dell'Idrologia, Perugia, 06/10/2015,
Abstract
Objective criteria for the identification of rainfall events are ambiguous or subjective, particularly when dealing ...
Objective criteria for the identification of rainfall events are ambiguous or subjective, particularly when dealing with the forecast of rainfall-induced landslides. In an attempt to overcome the problem, we developed an algorithm for the objective and reproducible reconstruction of rainfall events, and of rainfall conditions responsible for landslide occurrence (Melillo et al., 2015). The algorithm is implemented in a code written in the R language, and comprises three distinct modules to perform_ (i) the reconstruction of distinct rainfall events, in terms of rainfall duration (D in h) and cumulated event rainfall (E in mm), (ii) the identification of one or more rainfall ED conditions responsible for observed landslides, and (iii) the definition of rainfall thresholds for possible landslide occurrences.
The algorithm elaborates rainfall records and reconstructs individual rainfall events using pre-defined parameters to account for different geographical and climatic conditions. A comparison between rainfall characteristics in different regions can be performed.
We applied the algorithm in Sicily, southern Italy, using (i) rainfall measurements obtained from a network of 169 rain gauges, and (ii) information on 265 rainfall induced landslides occurred between January 2002 and December 2012. The algorithm reconstructed 29,270 rainfall events, corresponding to a mean of 24 rainfall events per year. For each rain gauge, the algorithm calculated statistics for the reconstructed rainfall events. The statistics have been proved useful for geographical and seasonal analysis of rainfall patterns.
Next, using information on landslide occurrence, the algorithm reconstructed 472 rainfall ED conditions as possible triggers of the observed failures. Then, the algorithm exploited the multiple rainfall conditions to define objective and reproducible empirical rainfall thresholds for the possible initiation of landslides. The calculated thresholds can be implemented in an operational early warning system for shallow landslide forecasting.
Maria Teresa Brunetti (1), Zhiyong Xiao (2,3), Goro Komatsu (4), Silvia Peruccacci (1), Federica Fiorucci (1),
Mauro Cardinali (1), Michele Santangelo (1), and Fausto Guzzetti (1), 2015, Landslides on Earth, Mars, Moon and Mercury,
Geophysical research abstracts (Online) 17 (2015).,
Abstract
Landslides play an important role in the evolution of landscapes on Earth and on other ...
Landslides play an important role in the evolution of landscapes on Earth and on other solid planets of the Solar
System. On Earth, landslides have been recognized in all continents, and in subaerial and submarine environments.
The spatial and temporal range of the observed slope failures is extremely large on Earth. Surface gravity is the
main factor driving landslides in solid planets. Comparison of landslide characteristics, e.g. the landslide types and
sizes (area, volume, fall height, length) on various planetary bodies may help in understanding the effect of surface
gravity on failure initiation and propagation. In the last decades, planetary exploration missions have delivered
an increasing amount of high-resolution imagery, which enables to resolve and identify morphologic structures
on planetary surfaces in great detail. Here, we present three geomorphological inventories of extraterrestrial landslides
on Mars, Moon and Mercury. To recognize and map the landslides on the three Solar System bodies, we
adopt the same visual criteria commonly used by geomorphologists to identify terrestrial slope failures in aerial
photographs or satellite images. Landslides are classified based on the morphological similarity with terrestrial
ones. In particular, we focus on rock slides mapped in Valles Marineris, Mars, and along the internal walls of impact
craters on the Moon and Mercury. We exploit the three inventories to study the statistical distributions of the
failure sizes (e.g., area, volume, fall height, length), and we compare the results with similar distributions obtained
for terrestrial landslides. We obtain indications on the effect of the different surface gravity on landslides on Earth
and Mars through the relationship between the landslide area and volume on the two planets. From the analysis of
the area, we hypothesize that the lack of medium size landslides on Mars is due to the absence of erosive processes,
which are induced on Earth chiefly by water-related weathering processes.We find that gravity is key to explain the
difference between the distribution of the landslide area on the Moon and Mercury. The different surface gravity
likely sets the minimum crater diameter at which slope failures start to occur.
Rossi M.; Torri D.; Santi E., 2015, Bias in topographic thresholds for gully heads,
Natural hazards (Dordr.) 79 (2015): 51–69. doi_10.1007/s11069-015-1701-2,
DOI: 10.1007%2Fs11069-015-1701-2
Abstract
The topographic threshold for overland flow gully head represents a promising tool for both research ...
The topographic threshold for overland flow gully head represents a promising tool for both research development and users. Nevertheless, some of the basic assumptions that were used to derive the threshold equation are also at the base for errors, including systematic ones, which introduce bias in the evaluations. Particularly, the assumption that the gully head catchment (GHC) area is a synonym for runoff causes is often false. This cause errors when calculating the threshold equation parameters (i.e. exponent and coefficient of the power equation linking critical slope gradient near the gully head to the GHC area). The assumption implies that every part of the GHC is connected via continuous overland flow paths to the outlet at the moment of peak discharge. Larger areas require larger concentration times, hence longer rainfall duration. This makes the occurrence of a rainfall intensity of the right duration to allow the total connectivity of the GHC less frequent (i.e. less probable). Also the land use (characterized by a specific vegetation type) and the soil conditions could have an effect on the probability that the previous assumption is verified. In order to show this, a distributed model developed in R was used to analyse where the conditions for gully erosion are actually verified. The hydrological part was developed based on the curve number (CN) approach, including the simulation of peak discharge with a few modifications/adaptations to a spatially distributed environment. A small routine was added to simulate concentrated flow erosion and condition for gully head formation. Then, a set of simulations were run using a series of daily rainfall amount and different land use/soil scenarios. Results show a clear effect of the vegetation distribution and patterns on gully head position in the simulated landscapes. From these results, it becomes evident that CN-weighted average in composite catchments needs to be replaced by a different averaging procedures, where the fraction of catchment area as CN weight is completed by an additional weight based on distances to the catchment outlets of the different land uses.
Nasri B.; Fouche O.; Torri D., 2015, Coupling published pedotransfer functions for the estimation of bulk density and saturated hydraulic conductivity in stony soils,
Catena (Cremling.) 131 (2015): 99–108. doi_10.1016/j.catena.2015.03.018,
DOI: 10.1016%2Fj.catena.2015.03.018
Abstract
Saturated hydraulic conductivity (Ks) is one of the key parameters in the design of engineering ...
Saturated hydraulic conductivity (Ks) is one of the key parameters in the design of engineering and environmental structures built in the unsaturated zone for infiltration purpose. Unfortunately, its field determination is laborious and expensive and suffers non-uniqueness. Besides, pedotransfer functions (PTFs) have been established to translate some measured soil matrix properties such as bulk density, organic matter and soil texture into Ks. Especially when the soil is heterogeneous, these PTFs may exhibit large differences between the matrix-predicted and in situ measured Ks. Moreover, there is no published PTF to predict Ks in stony soils. In this study, the objective is to estimate Ks in heterogeneous stony soils by combining already published PTFs. A methodology has been developed to evaluate the performance of the combinations of ten published PTFs predicting Ks from bulk density in fine soil matrix (BDm0) with thirty two published PTFs predicting BDm0 from the soil matrix texture properties. These 320 combined functions are likely to allow finding a correct estimation of Ks in most of fine soils but not in stony soils. To test this assumption, in situ Ks measurements with a Guelph permeameter and matrix texture and organic matter determinations in laboratory were carried out in a stony soil (colluvium from limestone). The magnitudes of measured Ks are much higher than the values predicted for the given texture of the matrix by 320 combined functions. This suggests that the rock fragment fraction in the soil plays an important role in accelerating the evacuation of water by increasing the cinematic porosity. Then, the empirical relation of Torri et al. (1994) is used to take into account this additional porosity within the real bulk density of the soil matrix. The retention capacity of the stony soil is controlled by the matrix content, which provides for a relation between rock fragment content and residual water content. Finally, six combined functions transformed by the Torri's relation are selected which predict Ks for a stony soil.
Bacaro G.,
Maccherini S.,
Chiarucci A.,
Jentsch A.,
Rocchini D.,
Torri D.,
Gioria M.,
Otto R.,
Escudero C. G.,
Fernandez-Lugo S.,
Fernandez-Palacios J.M.,
Arévalo J.R., 2015, Distributional patterns of endemic, native and alien species along a roadside elevational gradient in Tenerife, Canary Islands,
Community ecology (Print) 16 (2015): 223–234. doi_10.1556/168.2015.16.2.10,
DOI: 10.1556%2F168.2015.16.2.10
Abstract
Abstract: Invasion by alien plant species may be rapid and aggressive, causing erosion of local ...
Abstract: Invasion by alien plant species may be rapid and aggressive, causing erosion of local biodiversity. This is particularly true for islands, where natural and anthropogenic corridors promote the rapid spread of invasive plants. Although evidence shows that corridors may facilitate plant invasions, the question how their importance in the spread of alien species varies along environmental gradients deserves more attention. Here, we addressed this issue by examining diversity patterns (species richness of endemic, native and alien species) along and across roads, along an elevation gradient from sea-level up to 2050 m a.s.l. in Tenerife (Canary Islands, Spain), at multiple spatial scales. Species richness was assessed using a multi-scale sampling design consisting of 59 T-transects of 150 m × 2 m, along three major roads each placed over the whole elevation gradient. Each transect was composed of three sections of five plots each_ Section 1 was located on the road edges, Section 2 at intermediate distance, and Section 3 far from the road edge, the latter representing the "native community" less affected by road-specific dis- turbance. The effect of elevation and distance from roadsides was evaluated for the three groups of species (endemic, native and alien species), using parametric and non-parametric regression analyses as well as additive diversity partitioning. Differences among roads explained the majority of the variation in alien species richness and composition. Patterns in alien species were also affected by elevation, with a decline in species richness with increasing elevation and no alien recorded at high elevations. Elevation was the most important factor determining patterns in endemic and native species. These findings confirm that climate filtering reflected in varying patterns along elevational gradients is an important determinant of alien species richness, which are not adapted to high elevations, while anthropogenic pressures may explain alien species richness at low elevation.
Haydar Y. Hussin (a), Veronica Zumpano (b), Paola Reichenbach (c), Simone Sterlacchini (d), MihaiMicu (b), Cees vanWesten (a), Dan Balteanu (b), 2015, Different landslide sampling strategies in a grid-based bivariate statistical susceptibility model,
Geomorphology (Amst.) 253 (2015). doi_10.1016/j.geomorph.2015.10.030,
DOI: 10.1016%2Fj.geomorph.2015.10.030
Abstract
This study had three aims. The first was to assess the performance ...
This study had three aims. The first was to assess the performance of the weights-of-evidence (WofE) landslide susceptibility model in areas that are very different in terms of size, geoenvironmental settings, and landslide types. The second was to test the appropriate strategies to sample the mapped landslide polygon. The final aim was to evaluate the performance of the method to changes in the landslide sample size used to train the model. The method was applied to two areas_ the Fella River basin (eastern Italian Alps) containing debris flows, and Buzau County (Romanian Carpathians) with shallow landslides. The three landslide sampling strate- gies used were_ (1) the landslide scarp centroid, (2) points populating the scarp on a 50-m grid, and (3) the entire scarp polygon. The highest success rates were obtained when sampling shallow landslides as 50-m grid-points and debris flow scarps as polygons. Prediction rates were highest when using the entire scarp polygon method for both landslide types. The sample size test using the landslide centroids showed that a sample of 104 debris flow scarps was sufficient to predict the remaining 941 debris flows in the Fella River basin, while 161 shallow landslides was the minimum required number to predict the remaining 1451 scarps in Buzau County. Below these landslide sample thresholds, model performance was too low. However, using more landslides than the threshold produced a plateau effect with little to no increase in the model performance rates.
Fiorucci F.; Ardizzone F.; Rossi M.; Torri D., 2015, The use of stereoscopic satellite images to map rills and ephemeral gullies,
Remote sensing (Basel) 7 (2015): 14151–14178. doi_10.3390/rs71014151,
DOI: 10.3390%2Frs71014151
Abstract
Accurate mapping and measurement of erosion channels is necessary to accurately estimate the impact of ...
Accurate mapping and measurement of erosion channels is necessary to accurately estimate the impact of channeled erosion in an area. Field surveys can provide optimal quantitative results, but they are only applicable to small areas. Recently, photogrammetric techniques have been applied to small format aerial photographs that were taken by UAVs. Few studies have applied photogrammetry for mapping and measuring single permanent gullies using very high resolution stereoscopic satellite images. We explore the use of such images to map rills and ephemeral gullies and to measure the length, width and depth of individual erosion channels to estimate the eroded volumes. The proposed methodology was applied to the Collazzone area of Central Italy. All of the channel characteristics were determined using GeoEye-1® panchromatic stereoscopic satellite images of the 48-km2 study area and a 3D floating cursor. We identified, mapped, and measured the lengths of 555 channel segments. The top width and depth could be measured in only a subset of the channel segments (the SMC subset). The SMC data were used to determine the coefficients of the power law relationship between the rill/gully volume and length (V = aLb) and the uncertainties due to the channel depth measurements and the cross-sectional shape. The field data of the rill and gully volumes were within the estimated uncertainty. We defined a decision rule to distinguish rills from gullies on the basis of the segment length and applied the corresponding power law relationship that was derived from the SMC subset to estimate the eroded volume of the entire dataset. The erosion values that were calculated at different scales (0.680 Mg?ha-1 at the catchment scale, 28.4 Mg?ha-1 on the parcels affected by erosion) are consistent with values found in the literature. Our results indicate that erosion at the catchment scale can be considered moderate, whereas the erosion at the field scale exceeds the tolerance limit, which is consistent with data that have been summarized and/or discussed by several authors.
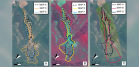
R. Schlögel (1), J.-P. Malet (1), A. Remaître (1), P. Reichenbach (2), and C. Doubre (1), 2015, Analysis of a landslide multi-date inventory in a complex mountain landscape_ the Ubaye valley case study,
Natural hazards and earth system sciences (Online) (2015): 2051–2098. doi_10.5194/nhessd-3-2051-2015,
DOI: 10.5194%2Fnhessd-3-2051-2015
Abstract
We propose a methodology (1) to prepare a multi-date landslide inventory for a mountainous area ...
We propose a methodology (1) to prepare a multi-date landslide inventory for a mountainous area affected by several landslide types with different degrees of activity, and (2) to estimate the temporal occurrence and the intensity of the landslides through the analysis of morphological indicators. The inventory, covering the period 1956-2010, is constructed for the middle section of the Ubaye valley (South French Alps) based on the analysis of multi-source documents (geomorphological maps, historical reports of landslide events, field surveys, series of orthophotographs and SAR satellite images). The uncertainties in the interpretation of the documents and the landslide morphological features are taken into account in relation to the scale of the source documents.
Several morphological indicators are calculated to describe quantitatively the evolution of the landslides (length, area, relative elevation, runout distance). Frequency-area density functions are calculated to estimate the changes in the landslide distributions. A Poisson model is used to estimate the probability of reactivation of the observed landslides. The proposed multi-date inventory and the associated statistics give additional information to the event catalogue managed by local authorities.
Taylor, Faith E and Malamud, Bruce D and Santangelo, Michele and Marchesini, Ivan and Guzzetti, Fausto, 2015, Statistical Patterns of Triggered Landslide Events and their Application to Road Networks,
egu 2015, Vienna, 12-17 april 2015,
Abstract
In the minutes to weeks after a landslide trigger such as an earthquake or heavy ...
In the minutes to weeks after a landslide trigger such as an earthquake or heavy rainfall, as part of a triggered landslide event, one individual to tens of thousands of landslides may occur across a region. If in the region, one or more roads become blocked by landslides, this can cause extensive detours and delay rescue and recovery operations. In this paper, we show the development, application and confrontation with real data of a model to simulate triggered landslide events and their impacts upon road networks. This is done by creating a 'synthetic' triggered landslide event inventory by randomly sampling landslide areas and shapes from already established statistical distributions. These landslides are then semi-randomly dropped across a given study region, conditioned by that region's landslide susceptibility. The resulting synthetic triggered landslide event inventory is overlaid with the region's road network map and the number, size, location and network impact of road blockages and landslides near roads calculated. This process is repeated hundreds of times in a Monte Carlo type simulation. The statistical distributions and approaches used in the model are thought to be generally applicable for low-mobility triggered landslides in many medium to high-topography regions throughout the world. The only local data required to run the model are a road network map, a landslide susceptibility map, a map of the study area boundary and a digital elevation model. Coupled with an Open Source modelling approach (in GRASS-GIS), this model may be applied to many regions where triggered landslide events are an issue. We present model results and confrontation with observed data for two study regions where the model has been applied_ Collazzone (Central Italy) where rapid snowmelt triggered 413 landslides in January 1997 and Oat Mountain (Northridge, USA), where the Northridge Earthquake triggered 1,356 landslides in January 1994. We find that when the landslide susceptibility map is adjusted along road corridors to take into account interactions between landslides and roads, the model reasonably well matches the two observed results. In Collazzone (length of road = 153 km, landslide density = 5.2 landslides km-2), the median number of road blockages over 100 model runs was 5.0 (±2.5 s.d.), compared to the observed number of 5 road blocks. In Northridge (length of road = 780 km, landslide density = 8.7 landslides km-2), the median number of road blockages over 100 model runs was 28.0.* (±14.4 s.d.) compared to the observed number of 48.0 road blocks. We are now working on applying the model to other locations and developing more sophisticated network impact analysis tools to improve the applicability of the model.
Salvati, Paola and Pernice, Umberto and Bianchi, Cinzia and Fiorucci, Federica and Marchesini, Ivan and Guzzetti, Fausto, 2015, Approaches to communication in response to geo-hydrological risk_ POLARIS an Italian web initiative.,
EGU General Assembly 2015, vienna, 12-17 april 2015,
Abstract
In the contemporary information and knowledge-based society, communication can foster effective responses to geo-hydrological risks, ...
In the contemporary information and knowledge-based society, communication can foster effective responses to geo-hydrological risks, by increasing awareness on the causes and consequences of specific hazards, e.g., landslides, debris flows, and floods, and by fostering the capacity of individuals, groups, and organizations to prepare, manage and recover from geo-hydrological events. In this context, communication plays a vital role in all phases of the disaster cycle. Although in the last few years the scientific community has begun to disseminate information on geo-hydrological hazards and the associated risks through thematic websites, these remain mainly addressed to experts for specific technical purposes with contents and web interfaces hardly appreciated by a wider audience and rarely synchronised with social networks. To address the problem posed by the lack of communication on geo-hydrological hazards with potential human consequence in Italy, we designed the POLARIS Web site. The initiative we are conducting has the main object of contributing, in different ways and at different geographical scales, to raise awareness about landslides and floods, and their impact on the Italian society. The website is structured into six main sections (i.e. Reports, Are you ready, Events, Alert Zones, Focus and Blog) that provide different and complementary information including, respectively_ periodical reports on landslide and flood risk to the population of Italy, suitable behaviors to adopt during damaging events, data and analyses on specific events, visual and detailed info on damaging events of the Italian Alert Zones defined by the Civil Protection Authority and blog-posts on landslide and flood events encouraging citizens' participation to crowd-sourcing information. Consultants experienced in project management, web-communication strategies on natural hazards, info-graphics, and user experience design were involved in the initiative to arrange and publish the information, considering usability and accessibility of the website, and key graphic aspects of web 2.0 information, making the web site communication more effective to users pertaining to diversified audiences. Specific icons are designed to describe the geo-hydrological events and maps to visualize their impact on the territory. The scientific and technical contents are edited using appropriate communication strategies which adopt a less technical and more widely comprehensible language, using intuitive and engaging web interfaces and linking messages to social media that encourage citizens' interactions. Monitoring the access of users to the website during more than a year after its publication, we noticed how the majority of the access corresponds to the occurrence of the worst geo-hydrological events and, in particular, when journalists or scientists promoted the website through television. Such a positive effect on the growth of users access suggested us to enhance our collaboration with scientific journalists by linking traditional (i.e. TV) and social media to further enlarge the awareness of website and to better explain users how to use the website information for increasing their resilience to geo-hydrological hazards.
Marchesini, Ivan and Mergili, Martin and Schneider-Muntau, Barbara and Alvioli, Massimiliano and Rossi, Mauro, 2015, Physically-based landslide susceptibility modelling_ geotechnical testing and model evaluation issues,
EGU General Assembly 2015, vienna, 12-17 april 2015,
Abstract
We used the software r.slope.stability for physically-based landslide susceptibility modelling in the 90 km2 Collazzone
area, ...
We used the software r.slope.stability for physically-based landslide susceptibility modelling in the 90 km2 Collazzone
area, Central Italy, exploiting a comprehensive set of lithological, geotechnical, and landslide inventory data.
The model results were evaluated against the inventory.
r.slope.stability is a GIS-supported tool for modelling shallow and deep-seated slope stability and slope failure
probability at comparatively broad scales. Developed as a raster module of the GRASS GIS software,
r.slope.stability evaluates the slope stability for a large number of randomly selected ellipsoidal potential sliding
surfaces. The bottom of the soil (for shallow slope stability) or the bedding planes of lithological layers (for
deep-seated slope stability) are taken as potential sliding surfaces by truncating the ellipsoids, allowing for the
analysis of relatively complex geological structures. To take account for the uncertain geotechnical and geometric
parameters, r.slope.stability computes the slope failure probability by testing multiple parameter combinations
sampled deterministically or stochastically, and evaluating the ratio between the number of parameter combinations
yielding a factor of safety below 1 and the total number of tested combinations. Any single raster cell may be
intersected by multiple sliding surfaces, each associated with a slope failure probability. The most critical sliding
surface is relevant for each pixel.
Intensive use of r.slope.stability in the Collazzone Area has opened up two questions elaborated in the present
work_
(i) To what extent does a larger number of geotechnical tests help to better constrain the geotechnical characteristics
of the study area and, consequently, to improve the model results? The ranges of values of cohesion and angle
of internal friction obtained through 13 direct shear tests corresponds remarkably well to the range of values suggested
by a geotechnical textbook. We elaborate how far an increased number of tests may help to further improve
the geotechnical parameterization of the model and, consequently, how much effort and resources should be put
into geotechnical sampling and testing for physically-based landslide susceptibility modelling.
(ii) What is the spatial unit most suitable to discretize landslide susceptibility maps? Whilst the GIS pixel is
the most commonly used level of discretization, slope units represent a valid alternative. Tests have shown that
the area under the ROC curve increases significantly when evaluating the slope failure probabilities yielded with
r.slope.stability at the level of slope units instead of pixels. At the level of slope units, the physically-based model
r.slope.stability outperforms statistical models applied to the Collazzone Area. However, there is good reason to
discuss the validity and the usefulness of different levels of discretization.
Marchesini, Ivan and Rossi, Mauro and Balducci, Vinicio and Salvati, Paola and Guzzetti, Fausto and Bianchini, Andrea and Grzeleswki, Emanuell and Canonico, Andrea and Coccia, Rita and Fiorucci, Gianni Mario and others, 2015, High-school software development project helps increasing students’ awareness of geo-hydrological hazards and their risks,
EGU General Assembly 2015, vienna, 12-17 april 2015,
Abstract
In Italy, inundation and landslides are widespread phenomena that impact the population and cause significant ...
In Italy, inundation and landslides are widespread phenomena that impact the population and cause significant economic damage to private and public properties. The perception of the risk posed by these natural geo-hydrological hazards varies geographically and in time. The variation in the perception of the risks has negative consequences on risk management, and limits the adoption of effective risk reduction strategies. We maintain that targeted education can foster the understanding of geo-hydrological hazards, improving their perception and the awareness of the associated risk. Collaboration of a research center experienced in geo-hydrological hazards and risks (CNR IRPI, Perugia) and a high school (ITIS Alessandro Volta, Perugia) has resulted in the design and execution of a project aimed at improving the perception of geo-hydrological risks in high school students and teachers through software development. In the two-year project, students, high school teachers and research scientists have jointly developed software broadly related to landslide and flood hazards. User requirements and system specifications were decided to facilitate the distribution and use of the software among students and their peers. This allowed a wider distribution of the project results. We discuss two prototype software developed by the high school students, including an application of augmented reality for improved dissemination of information of landslides and floods with human consequences in Italy, and a crowd science application to allow students (and others, including their families and friends) to collect information on landslide and flood occurrence exploiting modern mobile devices. This information can prove important e.g., for the validation of landslide forecasting models.
Marchesini, I. and Santangelo, M. and Guzzetti, F. and Cardinali, M. and Bucci, F., 2015, Assessing the influence of morpho-structural setting on landslide abundance,
Georisk (Online) (2015). doi_10.1080/17499518.2015.1058956,
DOI: 10.1080%2F17499518.2015.1058956
Abstract
Knowing the factors that influence landslide abundance and distribution is important to evaluate landslide susceptibility ...
Knowing the factors that influence landslide abundance and distribution is important to evaluate landslide susceptibility and hazard. Visual interpretation of aerial photographs (API) can be used to collect spatially distributed information on bedding attitude (BA), in an area. Where a map of the location of bedding traces (BTs), i.e. lines showing the intersection of bedding planes with the local topography, is available, the map can be used to obtain BA point data and to prepare maps showing morpho-structural domains. The possibility of using BA maps to investigate the influence of morpho-structural settings on landslide abundance is hampered by the lack of understanding of the influence of the length of the BTs, and of the parameters used to interpolate the BA data on the structural zonation. To investigate the problem, we used information on 207 BTs obtained through API in the Collazzone area, Central Italy, and we prepared 150 maps showing BA information. This was accomplished using 15 different values for the segmentation length of the BTs (S), and 10 different values for the tension parameter (T) used for the interpolation. We compare the results against previous results obtained for the same area adopting a heuristic approach to the segmentation of the same set of BTs. Next, we compare the geographical distribution of old deep-seated, deep-seated and shallow landslides in five morpho-structural domains in the study area, and we analyse the influence of the structural settings on the abundance of the different types of landslides
Santangelo, M. and Marchesini, I. and Bucci, F. and Cardinali, M. and Fiorucci, F. and Guzzetti, F., 2015, An approach to reduce mapping errors in the production of landslide inventory maps,
Natural hazards and earth system sciences (Print) 15 (2015): 2111–2126. doi_10.5194/nhess-15-2111-2015,
DOI: 10.5194%2Fnhess-15-2111-2015
Abstract
Landslide inventory maps (LIMs) show where
landslides have occurred in an area, and provide information
useful to ...
Landslide inventory maps (LIMs) show where
landslides have occurred in an area, and provide information
useful to different types of landslide studies, including
susceptibility and hazard modelling and validation, risk assessment,
erosion analyses, and to evaluate relationships between
landslides and geological settings. Despite recent technological
advancements, visual interpretation of aerial photographs
(API) remains the most common method to prepare
LIMs. In this work, we present a new semi-automatic procedure
that makes use of GIS technology for the digitization
of landslide data obtained through API. To test the procedure,
and to compare it to a consolidated landslide mapping
method, we prepared two LIMs starting from the same set of
landslide API data, which were digitized (a) manually adopting
a consolidated visual transfer method, and (b) adopting
our new semi-automatic procedure. Results indicate that the
new semi-automatic procedure (a) increases the interpreter's
overall efficiency by a factor of 2, (b) reduces significantly
the subjectivity introduced by the visual (manual) transfer
of the landslide information to the digital database, resulting
in more accurate LIMs. With the new procedure, the
landslide positional error decreases with increasing landslide
size, following a power-law. We expect that our work will
help adopt standards for transferring landslide information
from the aerial photographs to a digital landslide map, contributing
to the production of accurate landslide maps.
fausto Guzzetti, 2015, Competenze e responsabilità: un problema aperto,
2015,
Abstract
Per combattere il dissesto occorre uscire dalla logica dell'emergenza, con prospettive di lungo periodo basate ...
Per combattere il dissesto occorre uscire dalla logica dell'emergenza, con prospettive di lungo periodo basate su regole certe e condivise e su una volonta? collettiva di farle rispettare. Devono anche allargarsi le competenze necessarie per la pianificazione e gestione del territorio.
Fausto Guzzetti, 2015, Previsione operativadelle frane_ il sistema SANF,
2015,
Abstract
PER SUPPORTARE IL CENTRO FUNZIONALE NAZIONALE DI PROTEZIONE CIVILE, CNR-IRPI HA SVILUPPATO UN SISTEMA DI ...
PER SUPPORTARE IL CENTRO FUNZIONALE NAZIONALE DI PROTEZIONE CIVILE, CNR-IRPI HA SVILUPPATO UN SISTEMA DI ALLERTAMENTO NAZIONALE PER LA POSSIBILE OCCORRENZA DI FENOMENI FRANOSI INDOTTI DA PIOGGE. LE CARATTERISTICHE TECNICHE E OPERATIVE DEL SISTEMA SANF, UTILIZZATO DAL 2009.
Fausto Guzzetti, 2015, Statistica e modellisticaper valutare il rischio frane,
2015,
Abstract
VALUTARE IL RISCHIO DA FRANA E? OPERAZIONE COMPLESSA. LA VALUTAZIONE DELLA SUSCETTIBILITA? DI FRANE DI ...
VALUTARE IL RISCHIO DA FRANA E? OPERAZIONE COMPLESSA. LA VALUTAZIONE DELLA SUSCETTIBILITA? DI FRANE DI SCORRIMENTO SI PUO? AVVALERE DI METODI STATISTICI BASATI SU VARIABILI GEO-AMBIENTALI O SU MODELLI NUMERICI CHE ACCOPPIANO MODELLI DI STABILITA? A MODELLI DI INFILTRAZIONE E A MODELLI IDROLOGICI O IDROGEOLOGICI SEMPLIFICATI.
Fausto Guzzetti, 2015, Frane e alluvioni, una lunga storia italiana,
2015,
Abstract
LE PRIME INFORMAZIONI SU FRANE E INONDAZIONI IN ITALIA RISALGONO ALL'EPOCA ROMANA. LA PIU? ANTICA ...
LE PRIME INFORMAZIONI SU FRANE E INONDAZIONI IN ITALIA RISALGONO ALL'EPOCA ROMANA. LA PIU? ANTICA INONDAZIONE DI CUI ABBIAMO NOTIZIA AVVENNE LUNGO IL TEVERE NEL 414 AC. NEGLI ULTIMI 100 ANNI SI SONO VERIFICATE ALMENO 1.319 FRANE CHE HANNO PRODOTTO 7424 VITTIME (MORTI, DISPERSI E FERITI). I DATI DEL CATALOGO E DEI RAPPORTI CNR-IRPI.
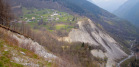
Rosa María Mateos (1), Inmaculada García-Moreno (1), Paola Reichenbach(2), Gerardo Herrera (1),
Roberto Sarro (1), Joan Rius (3), Raúl Aguiló (3), Federica Fiorucci (2), 2015, Calibration and validation of rockfall modelling at regional scale_ application along a roadway in Mallorca (Spain) and organization of its management,
Landslides (Berl., Internet) (2015). doi_10.1007/s10346-015-0602-5,
DOI: 10.1007%2Fs10346-015-0602-5
Abstract
The Tramuntana range, in the northwestern sector of the island of Mallorca (Balearic Islands, Spain), ...
The Tramuntana range, in the northwestern sector of the island of Mallorca (Balearic Islands, Spain), is frequently affected by rockfalls which have caused significant damage, mainly along the road network. In this work, we present the procedure we have applied to calibrate and validate rockfall modelling in this region, using 103 cases of the available detailed rockfall inventory (630 rockfall events collected since the eighteenth century). We have exploited STONE (Guzzetti et al. 2002), a GIS-based rockfall simulation software which computes 2D and 3D rockfall trajectories starting from a DTM and maps of the dynamic rolling friction coefficient and of the normal and tangential energy restitution
coefficients. The appropriate identification of these parameters
determines the accuracy of the simulation. To calibrate them, we
have selected 40 rockfalls along the range which include a wide
variety of outcropping lithologies. Coefficients values have been
changed in numerous attempts in order to select those where the
extent and shape of the simulation matched the field mapping.
Best results were summarized with the average statistical values for
each parameter and for each geotechnical unit, determining that
mode values represent more precisely the data. Initially, for the
validation stage, 10 well-known rockfalls exploited in the calibration
phase have been selected. Confidence tests have been applied
to their modelling results taking into account not only the success
but also the mistakes. The best accuracy is obtained when the
rockfall has a preferential trajectory and worse results when the
rockfall follows two or more trajectories. Additionally, the greater
the rockfall runout length, the less precise the simulation is. We
have further validated the calibrated parameters along the Maroad
(111 km), the main transportation corridor in the range, using
63 rockfall events that occurred during the past 18 years along the
road. Of the rockfalls where source areas were properly identified,
81.5 % are well represented by STONE modelling, as the travel
paths and the depositional areas are successfully ascertained. Results
of the analysis have been used by the Road Maintenance
Service of Mallorca to assess hazard and risk posed by rockfall at
regional scale to design the road management plan
A. Tarpanelli, L. Brocca, S. Barbetta, T. Lacava, M. Faruolo, and T. Moramarco, 2015, Integration of MODIS and Radar Altimetry Data for River Discharge Estimation from Space,
Engineering Geology for Society and Territory - River Basins, Reservoir Sedimentation and Water Resources, edited by Giorgio Lollino, Massimo Arattano, Massimo Rinaldi, Orazio Giustolisi, Jean-Christophe Marechal, Gordon E. Grant, pp. 607–610. CH-6330 Cham (ZG): Springer International Publishing, 2015,
Abstract
The study integrates data provided by Moderate Resolution Imaging Spectroradiometer, MODIS, onboard AQUA satellite and ...
The study integrates data provided by Moderate Resolution Imaging Spectroradiometer, MODIS, onboard AQUA satellite and by RA-2 altimeter onboard ERS-2 and ENVISAT satellites for river discharge estimation along the Po River (northern Italy). The discharge is estimated by multiplying the velocity estimated from MODIS by the flow area computed considering the water level derived by altimetry data. In the case of river cross-section survey not available, the entropy theory may be applied for reconstructing the bathymetry starting from the water surface elevation observed or retrieved by the altimeter. The discharge estimation is validated using in-situ measurements of the nearest hydrometric station where daily observations are available for the period from February 2005 to August 2010. The agreement with the observed discharge is fairly satisfactory with coefficient of correlation equal to 0.91 and root mean square error of 37 % against observed discharge. The results suggest that the proposed methodology has potential applications from the forthcoming SENTINEL-3 mission, in which two similar sensors will be onboard the same satellite platform and where significant improvements will be obtained in terms of vertical accuracy and spatial and temporal resolution.
Lacava, T., Brocca, L., Coviello, I., Faruolo, M., Pergola, N., Tramutoli, V., 2015, Integration of Optical and Passive Microwave Satellite Data for Flooded Area Detection and Monitoring,
Engineering Geology for Society and Territory - Engineering Geology for Society and Territory, edited by Giorgio Lollino, Massimo Arattano, Massimo Rinaldi, Orazio Giustolisi, Jean-Christophe Marechal, Gordon E. Grant, pp. 631–635. CH-6330 Cham (ZG): Springer International Publishing, 2015,
Abstract
Flooding represents a serious threat to millions of people around the world and its hazard ...
Flooding represents a serious threat to millions of people around the world and its hazard is rising as a result of climate changes. From this perspective, flood risk management is a key focus of many governments, whose priority is to have frequently updated and accurate information about the flood state and evolution to promptly react to the disaster and to put in place effective countermeasures devoted to limit damages and human lives losses. Remote sensing technology allows for flood monitoring at different spatial and temporal resolutions with an adequate level of accuracy. In particular, for emergency response purposes, an integrated use of satellite data, acquired by both optical and passive or active microwave instruments, has to be preferred to have more complete and frequently updated information on soil conditions and to better support decision makers. In this framework, multi-year time series of MODIS (Moderate Resolution Imaging Spectroradiometer) and AMSR-E (Advanced Microwave Scanning Radiometer for Earth Observing System) data were processed and analyzed. In detail, the Robust Satellite Techniques (RST), a multi-sensor approach for satellite data analysis, has been implemented for studying the August 2002 Elbe river flood occurred in Germany, trying to assess the potential of such an integrated system for the determination of soil status and conditions (i.e. moisture variation, water presence) as well as for a timely detection and a near real time monitoring of critical soil conditions.
Ciabatta, L., Brocca, L., Moramarco, T., Wagner, W., 2015, Comparison of different satellite rainfall products over the Italian territory,
Engineering Geology for Society and Territory, pp. 623–626, 2015,
Abstract
In this study, a preliminary analysis of three satellite-derived rainfall products is carried out in ...
In this study, a preliminary analysis of three satellite-derived rainfall products is carried out in order to evaluate their reliability and accuracy. Specifically, two state-of-art rainfall products are used_ the PR-OBS-5 provided by EUMETSAT within the Satellite Application Facility on Support to Operational Hydrology and Water Management (H-SAF) project and the 3B42-RT product from the Tropical Rainfall Measuring Mission (TRMM) Multiple Precipitation Analysis (TMPA). The third product is obtained by applying a new inversion method, called SM2RAIN, to satellite soil moisture data. In this latter approach, the soil is considered to be a "natural raingauge" that is employed for "measuring" rainfall. As benchmark, quality checked daily rainfall observations throughout the Italian territory for the period 2010-2011 are used. The comparison with ground observations is carried out in terms of correlation coefficients, R, and root mean square error, RMSE. The results show satisfactory R-values (and low RMSEs) between satellite and observed 5-day rainfall data with median R-values greater than 0.50. Moreover, by analyzing the error spatial patterns, and by considering the different temporal resolution of the products, the potential of integrating them in space and time is underlined as this can be expected to further improve the estimation of rainfall for hydrological applications over the Italian territory.
Christian Massari 1;*, Luca Brocca 1, Luca Ciabatta 1, Tommaso Moramarco 1, Simone Gabellani 2, Clement Albergel 3, Patricia De Rosnay 3, Silvia Puca 4 and Wolfgang Wagner 5, 2015, The use of H-SAF soil moisture products for operational hydrology_ flood modelling over Italy,
Hydrology 2 (2015): 2–22. doi_10.3390/hydrology2010002,
DOI: 10.3390%2Fhydrology2010002
Abstract
The ever increasing availability of new remote sensing and land surface model datasets opens new ...
The ever increasing availability of new remote sensing and land surface model datasets opens new chances for hydrologists in improving flood forecasting systems. The current study investigates the performance of two operational soil moisture (SM) products provided by "EUMETSAT Satellite Application Facility on Support to Operational Hydrology and Water Management" (H-SAF, http_//hsaf.meteoam.it/) within a recently developed hydrological model called "Simplified Continuous Rainfall-Runoff Model" (SCRRM) and the possibility to use such a model at an operational level. The model uses SM datasets derived from external sources (i.e. remote sensing and land surface models) as input for calculating the initial wetness conditions of the catchment prior to the flood event. Hydro-meteorological data from 35 Italian catchments ranging from 800 to 7400 km2 was used for the analysis for a total of 593 flood events. The results show that H-SAF operational products used within SCRRM satisfactorily reproduces the selected flood events providing a median Nash-Sutcliffe efficiency index equal to 0.64 (SM-OBS-1) and 0.60 (SM-DAS-2), respectively. Given the results obtained along with the parsimony, the simplicity and independence of the model from continuously recorded rainfall and evapotranspiration data, the study suggests that i) SM-OBS-1 and SM-DAS-2 contain useful information for flood modelling which can be exploited in flood forecasting, ii) SCRRM is expected to be beneficial as a component of a real-time flood forecasting systems in regions characterized by low data availability where a continuous modelling approach can be problematic.
Maccioni P.1, Kossida M.2, Brocca L.3, Moramarco T.4, 2015, Assessment of the drought hazard in the Tiber River Basin in Central Italy and a comparison of new and commonly used meteorological indicators,
Journal of hydrologic engineering 20 (2015): 05014029. doi_10.1061/(ASCE)HE.1943-5584.0001094,
DOI: 10.1061%2F(ASCE)HE.1943-5584.0001094
Abstract
Drought is one of the most common natural hazards with adverse impacts on agriculture and ...
Drought is one of the most common natural hazards with adverse impacts on agriculture and the water resources. This study aims to spatially analyse the drought hazard in the Upper Tiber River basin and find a representative indicator on the basis of meteorological data which are widely available. To this end, the significance of using solely precipitation versus including evapotranspiration (ET) in drought characterisation is thoroughly investigated. Three relevant indicators are considered_ 1) a new index SP*ETI (Standardized effective Precipitation EvapoTranspiration Index) incorporating, besides ET, the losses due to runoff; 2) the commonly used SPI (Standardized Precipitation Index) and 3) the RDI (Drought Reconnaissance Index). A comparison is undertaken at various time scales (9, 12, 24-months) using precipitation and temperature data from 2 stations for the period 1953-2011, for which complete rainfall and temperature timeseries are available. This analysis demonstrates_ i) the very similar evolution and behaviour of the 3 indexes; ii) the reliability of the SPI for drought monitoring and characterisation in the case of the Upper Tiber River basin, also using observed hydrological impacts as well. Based on these findings, a longer data set of available precipitation data (45 stations, 96 years long timeseries from 1916-2011) is used to calculate the SPI12, and to derive four new sub-indicators 2 reflecting the intensity, magnitude, duration and frequency of drought events. These sub-indicators, once classified, are blended into a Drought Hazard Index (DHI), thus providing a more holistic characterization of the drought hazard on a scale 1-4. A spatial analysis is finally performed across the resulting DHI values in order to investigate the spatial variability of drought hazard and identify drought prone areas. It is found that the most vulnerable areas are located in the southern and eastern part of the Upper Tiber River basin, while the north-central part is less affected by drought conditions.
Ciabatta, Luca; Brocca, Luca; Massari, Christian; Moramarco, Tommaso; Puca, Silvia; Rinollo, Angelo; Gabellani, Simone; Wagner, Wolfgang, 2015, Integration of Satellite Soil Moisture and Rainfall Observations over the Italian Territory,
Journal of hydrometeorology (Print) 16 (2015): 1341–1355. doi_10.1175/JHM-D-14-0108.1,
DOI: 10.1175%2FJHM-D-14-0108.1
Abstract
State-of-the-art rainfall products obtained by satellites are often the only way of measuring rainfall in ...
State-of-the-art rainfall products obtained by satellites are often the only way of measuring rainfall in remote areas of the world. However, it is well known that they may fail in properly reproducing the amount of precipitation reaching the ground, which is of paramount importance for hydrological applications. To address this issue, an integration between satellite rainfall and soil moisture SM products is proposed here by using an algorithm, SM2RAIN, which estimates rainfall from SM observations. A nudging scheme is used for integrating SM-derived and state-of-the-art rainfall products. Two satellite rainfall products are considered_ H05 provided by EUMESAT and the real-time (3B42-RT) TMPA product provided by NASA. The rainfall dataset obtained through SM2RAIN, SM2R(ASC), considers SM retrievals from the Advanced Scatterometer (ASCAT). The rainfall datasets are compared with quality-checked daily rainfall observations throughout the Italian territory in the period 2010-13. In the validation period 2012-13, the integrated products show improved performances in terms of correlation with an increase in median values, for 5-day rainfall accumulations, of 26% (18%) when SM2R(ASC) is integrated with the H05 (3B42-RT) product. Also, the median root-mean-square error of the integrated products is reduced by 18% and 17% with respect to H05 and 3B42-RT, respectively. The integration of the products is found to improve the threat score for medium-high rainfall accumulations. Since SM2R(ASC), H05, and 3B42-RT datasets are provided in near-real time, their integration might provide more reliable rainfall products for operational applications, for example, for flood and landslide early warning systems.
Brocca, Luca; Massari, Christian; Ciabatta, Luca; Moramarco, Tommaso; Penna, Daniele; Zuecco, Giulia; Pianezzola, Luisa; Borga, Marco; Matgen, Patrick; Martinez-Fernandez, Jose, 2015, Rainfall estimation from in situ soil moisture observations at several sites in Europe_ an evaluation of the SM2RAIN algorithm,
Vodohospodársky casopis (Tlacené vyd.) 63 (2015): 201–209. doi_10.1515/johh-2015-0016,
DOI: 10.1515%2Fjohh-2015-0016
Abstract
Rain gauges, weather radars, satellite sensors and modelled data from weather centres are used operationally ...
Rain gauges, weather radars, satellite sensors and modelled data from weather centres are used operationally for estimating the spatial-temporal variability of rainfall. However, the associated uncertainties can be very high, especially in poorly equipped regions of the world. Very recently, an innovative method, named SM2RAIN, that uses soil moisture observations to infer rainfall, has been proposed by Brocca et al. (2013) with very promising results when applied with in situ and satellite-derived data. However, a thorough analysis of the physical consistency of the SM2RAIN algorithm has not been carried out yet. In this study, synthetic soil moisture data generated from a physically-based soil water balance model are employed to check the reliability of the assumptions made in the SM2RAIN algorithm. Next, high quality and multiyear in situ soil moisture observations, at different depths (5-30 cm), and rainfall for ten sites across Europe are used for testing the performance of the algorithm, its limitations and applicability range.
SM2RAIN shows very high accuracy in the synthetic experiments with a correlation coefficient, R, between synthetically generated and simulated data, at daily time step, higher than 0.940 and an average Bias lower than 4%. When real datasets are used, the agreement between observed and simulated daily rainfall is slightly lower with average R-values equal to 0.87 and 0.85 in the calibration and validation periods, respectively. Overall, the performance is found to be better in humid temperate climates and for sensors installed vertically. Interestingly, algorithms of different complexity in the reproduction of the underlying hydrological processes provide similar results. The average contribution of surface runoff and evapotranspiration components amounts to less than 4% of the total rainfall, while the soil moisture variations (63%) and subsurface drainage (30%) terms provide a much higher contribution. Overall, the SM2RAIN algorithm is found to perform well both in the synthetic and real data experiments, thus offering a new and independent source of data for improving rainfall estimation, and consequently enhancing hydrological, meteorological and climatic studies.
Aigner J., Habersack H., Rindler R., Blamauer B., Wagner B., Schober B., Comiti F., Dell'Agnese A., Engel M., Liebault F., Bel C., Bellot H., Fontaine F., Piegay H., Benacchio V., Lemaire P., Ruiz-Villanueva V., Vaudor L., Cavalli M., Marchi L., Crema S., Brardinoni, F., Bezak N., Rusjan S., Miko? M., Abel J., Becht M., Heckmann T., Rimböck A., Schwaller G., Höhne R., Cesca M., Vianello A., Krivograd Klemen?i? A., Pape? J., Lenzi M.A., Picco L., Moretto J., Ravazzolo D., Jäger G., Moser M., Hübl J., Chiari M., 2015, Sediment transport monitoring,
2015,
Abstract
The SedAlp project contributes to an integrated management of sediment transport in Alpine basins. It ...
The SedAlp project contributes to an integrated management of sediment transport in Alpine basins. It is directed to an effective reduction of sediment-related risk while promoting the enhancement of riverine ecosystems and reducing the impacts of hydropower plants (balancing the implementation of EU Directives and national law e.g. RES, WFD, NGP etc.). SedAlp includes pilot actions in various representative Alpine river basins of five countries and contributes in particular to monitor sediment and wood transfer in a large set of Alpine catchments. A major goal of the project was to understand spatial and temporal variability of processes and to provide planning, warning and predictive tools but also sediment and wood management recommendations for protecting people. Furthermore the project includes strategy policy development and implementation actions for the improvement of sediment continuity in Alpine river basins. SedAlp regards the geological and climatic variability across the Alps that generate complex patterns of sediment transfer, whereas management conflicts are similar. To reach the ambitious goals of the project, it is essential to understand the key processes of sediment and wood transport.
Workpackage 5 with the title "sediment transport monitoring" was focused to enhance the knowledge about these transport processes by conducting the first standardized transnational monitoring of sediment and wood transport in Alpine basins. WP5 concentrated on monitoring and assessing fluxes of sediment and wood at the local scale. Measured fluxes are strongly depending on the supply from the catchment and on the connectivity to source areas, analysed in WP4. The output of WP5 feeds WP6 which studied the interferences between structures and sediment/wood fluxes and forms the basis for WP7 which linked the catchment with channel processes. Finally, the results of WP5 contribute to policy recommendations in WP8.
Within WP5, monitoring activities on 28 different pilot sites in Austria, Germany, France, Italy and Slovenia have been conducted between 2012 and 2015. The monitored transport processes covered woody debris, debris flow, bedload and suspended load. The different pilot sites showed a great diversity in catchment size, channel slope and hydraulic parameters and covered the whole bandwidth from small, high alpine catchments (e.g. Strimm_ 5 km² catchment size, 2427 m elevation a.s.l) to large catchments in the alpine valleys (e.g. Drau/Dellach: 2131 km² catchment size, 600 m elevation a.s.l). With the results of the monitoring activities, a database using different parameters regarding the transport process has been established and reflects the big diversity of the different pilot sites. The coordinated sediment transport monitoring outlined the links between the various processes responsible for sediment delivery at catchment scale and stresses out the need for a closer integration between the monitoring of various sediment transport processes in Alpine headwaters.
Due to the wide range of different measurement methods used within the project, one focus of this work package was to standardize the measurement procedures and harmonize data analysis. This led to the 1st milestone "Protocol on standardized data collection methods in sediment transport monitoring for transboundary exchange". These protocols were intended to describe the used monitoring techniques and data processing methods for debris flows, wood transport and bedload transport. Furthermore, the protocols work also as guidelines to assist in choosing the appropriate monitoring method for supporting prospective monitoring efforts.
4
An important aspect of the project was to understand spatial and temporal variability of the monitored processes. The observed appearance of clockwise and counter clockwise hysteresis effects between sediment and discharge, showed the significant role of the location of the active sediment source in the temporal variability of sediment transport.
Analysis of the spatial distribution showed an evolvement of the bedload transport width with increasing discharge which provides vital information for an improved planning of river related measures. To determine these process related variability, the use of appropriate monitoring methods as well as their right application is of great importance. Indirect monitoring methods (e.g. geophone devices) pointed out their potential in the automatic and continuous detection of these transport processes. The presented data reflect a high spatial and temporal variability in the occurrence of bedload, suspended load debris flow and wood transport and reveal significant consequences for the practical usage of monitoring methods, data and application.
Many river engineering tasks require detailed information about the extent of sediment transport and wood mobility, which are provided by sediment and wood transport relations and equations. The 3rd milestone "First set of practically applicable bedload/wood transport relations and models" gives an overview about the most common transport relations and formulas. Furthermore it presents the difficulties and challenges in the application of these relations and shows the last developments in improving transport equations. The comparison between measured and calculated specific bedload transport rates showed substantial differences in the derived results. For the practical use of these relations it is strongly recommended to select, calibrate and validate the sediment and wood transport equations using monitored field data.
The evaluation of river restoration projects showed the need of an improved process understanding between sediment transport an engineering measures. The functionality and sustainability of river restoration measures are, beside the hydrologic and hydraulic conditions, mainly depending on the superior sediment regime and thus the sediment input into the reach. By increase or decrease of the mean sediment input, the hydraulic and thus morphological conditions of the reach need to rearrange to the given input by e.g. lateral and vertical adjustments of the river bed or by changing the river type.
Tayfur, Gokmen; Brocca, Luca, 2015, Fuzzy Logic for Rainfall-Runoff Modelling Considering Soil Moisture,
Water resources management (2015). doi_10.1007/s11269-015-1012-0,
DOI: 10.1007%2Fs11269-015-1012-0
Abstract
This study developed Mamdani-type fuzzy logic model to simulate daily discharge as a function of ...
This study developed Mamdani-type fuzzy logic model to simulate daily discharge as a function of soil moisture measured at three different depths (10, 20 and 40 cm) and rainfall. The model was applied to 13 km2 size Colorso Basin in central Italy for a period from October 2002 to April 2004. For each variable of soil moisture, rainfall, and discharge, 9 fuzzy subsets were employed while 30 fuzzy rules, relating the input variables (soil moisture and rainfall) to the output variable (discharge), were optimized. The model employed the min inferencing, max composition, and the centroid method. The model application results revealed that Mamdani-type fuzzy logic model can be employed to incorporate soil moisture along with rainfall to simulate discharge. Using soil moisture measured at 40 cm soil depth along with rainfall produced better simulation of discharge with NS = 0.68 and R = 0.82. The performance of the model was also tested against a conceptual rainfall-runoff model of MISDc (Modello Idrologico Semi-Distribuito in continuo). MISDc couples an event-specific component with a module for continuous time soil water balance for taking into account the variable antecedent wetness conditions. The MISDc model requires estimation of seven parameters and the measurements of the hydrometeorological variables such as rainfall and air temperature. The comparative study revealed that fuzzy model performs better in capturing runoff peak rates and overall trend of high and small flooding events.
Franz, Trenton E.; Wang, Tiejun; Avery, William; Finkenbiner, Catherine; Brocca, Luca, 2015, Combined analysis of soil moisture measurements from roving and fixed cosmic ray neutron probes for multiscale real-time monitoring,
Geophysical research letters 42 (2015): 3389–3396. doi_10.1002/2015GL063963,
DOI: 10.1002%2F2015GL063963
Abstract
Soil moisture partly controls land-atmosphere mass and energy exchanges and ecohydrological processes in natural and ...
Soil moisture partly controls land-atmosphere mass and energy exchanges and ecohydrological processes in natural and agricultural systems. Thus, many models and remote sensing products continue to improve their spatiotemporal resolution of soil moisture, with some land surface models reaching 1km resolution. However, the reliability and accuracy of both modeled and remotely sensed soil moisture require comparison with ground measurements at the appropriate spatiotemporal scales. One promising technique is the cosmic ray neutron probe. Here we further assess the suitability of this technique for real-time monitoring across a large area by combining data from three fixed probes and roving surveys over a 12km×12km area in eastern Nebraska. Regression analyses indicated linear relationships between the fixed probe averages and roving estimates of soil moisture for each grid cell, allowing us to derive an 8h product at spatial resolutions of 1, 3, and 12km, with root-mean-square error of 3%, 1.8%, and 0.9%. Key Points Combine fixed and roving cosmic ray neutron soil moisture data sets Data merging techniques to design soil moisture network at different scales Soil moisture network can provide spatiotemporal data and stats for downscaling
Matthias Vanmaercke (1,2), Francesca Ardizzone (3), Mauro Rossi (3), and Fausto Guzzetti (3), 2015, Seismic controls on contemporary sediment yields in Italy_ the link with landslide susceptibility,
Geophysical research abstracts (Online) (2015).,
Maria Teresa Brunetti (1,2), Zhiyong Xiao (3,4), Goro Komatsu (5), Silvia Peruccacci (1), Fausto Guzzetti (1), 2015, Large rock slides in impact craters on the Moon and Mercury,
Icarus (N.Y.N.Y. 1962) (2015). doi_10.1016/j.icarus.2015.07.014,
DOI: 10.1016%2Fj.icarus.2015.07.014
Abstract
Impact craters are the most common surface features on the Moon and Mercury. On these ...
Impact craters are the most common surface features on the Moon and Mercury. On these two bodies, we recognized and mapped large landslides on the walls of impact craters. Through visual inspection of high-resolution imagery, we compiled an inventory of 60 landslides on the Moon and a second inventory of 58 landslides on Mercury. Adopting categories used to catalog terrestrial mass movements, we classified the landslides on the Moon and Mercury as rock slides. We determined the probability density distribution of their planimetric area, and we compared the distributions with similar distributions for terrestrial and martian landslides using data from the literature. We found that rock slides mapped in impact craters on the Moon are, on average, larger than analogous rock slides on Mercury. The relationship between the area of the individual rock slides and the area of the hosting crater suggests that rock slides on Mercury initiate in smaller craters. We hypothesize that the above findings are an effect of the weaker surface gravity of the Moon compared to that of Mercury and/or an effect of the rock material properties.
Guzzetti Fausto, 2015, Forecasting natural hazards, performance of scientists, ethics and the need for transparency,
Toxicological and environmental chemistry (Online) (2015). doi_10.1080/02772248.2015.1030664,
DOI: 10.1080%2F02772248.2015.1030664
Abstract
Landslides are one of several natural hazards. As other natural hazards, landslides are difficult to ...
Landslides are one of several natural hazards. As other natural hazards, landslides are difficult to predict, and their forecasts are uncertain. The uncertainty depends on the poor understanding of the phenomena that control the slope failures, and on the inherent complexity and chaotic nature of the landslides. This is similar to other natural hazards, including hurricanes, earthquakes, volcanic eruptions, floods, and droughts. Due to the severe impact of landslides on the population, the environment, and the economy, forecasting landslides is of scientific interest and of societal relevance, and scientists attempting to forecast landslides face known and new problems intrinsic to the multifaceted interactions between science, decision-making, and the society. The problems include deciding on the authority and reliability of individual scientists and groups of scientists, and evaluating the performances of individual scientists, research teams, and their institutions. Related problems lay in the increasing subordination of research scientists to politics and decision-makers, and in the conceptual and operational models currently used to organize and pay for research, based on apparently objective criteria and metrics, considering science as any other human endeavor, and favoring science that produces results of direct and immediate application. The paper argues that the consequences of these problems have not been considered fully.
Tarpanelli, Angelica; Brocca, Luca; Barbetta, Silvia; Faruolo, Mariapia; Lacava, Teodosio; Moramarco, Tommaso, 2015, Coupling MODIS and Radar Altimetry Data for Discharge Estimation in Poorly Gauged River Basins,
IEEE journal of selected topics in applied earth observations and remote sensing (Print) 8 (2015): 141–148. doi_10.1109/JSTARS.2014.2320582,
DOI: 10.1109%2FJSTARS.2014.2320582
Abstract
The capability of coupling measurements of river velocity derived from Moderate Resolution Imaging Spectroradiometer (MODIS) ...
The capability of coupling measurements of river velocity derived from Moderate Resolution Imaging Spectroradiometer (MODIS) and water levels derived from ENVISAT Advanced Radar Altimeter (RA-2) for river discharge estimation is thoroughly investigated. The method is applied even considering the possible unavailability of the river cross-section survey by using the entropy theory for reconstructing the bathymetry. The discharge estimation accuracy is validated using in situ measurements along the Po River (Northern Italy) where daily observations are available for the period 2005-2010. The agreement with the observed discharge is fairly satisfactory with coefficient of correlation of 0.91 and relative root-mean-square error (RMSE) of ~ 37% on average. Therefore, the coupling of the two sensors provides, with a good level of accuracy, the hydraulic quantities to use for discharge estimation. These results are particularly significant for the forthcoming European Space Agency Sentinel-3 mission, in which a visible-near infrared multispectral sensor and an altimeter will be onboard the same satellite platform providing significant improvements in terms of vertical accuracy and spatial-temporal resolution.
Salvati Paola, Bianchi Cinzia, Guzzetti Fausto, 2015, Rapporto periodico sul rischio posto alla popolazione italiana da frane e inondazioni – Anno 2014,
2015,
Abstract
Il Rapporto Periodico sul Rischio posto alla Popolazione italiana da Frane e Inondazioni contiene elenchi, ...
Il Rapporto Periodico sul Rischio posto alla Popolazione italiana da Frane e Inondazioni contiene elenchi, mappe, statistiche ed analisi sugli eventi di frana e d'inondazione che hanno causato danni diretti alla popolazione nel periodo compreso fra il 1 gennaio e il 31 dicembre 2014, e nei periodi fra il 2009 e il 2013 e fra il 1964 e il 2013
Santangelo, Michele, and Gioia, Dario and Cardinali, Mauro and Guzzetti, Fausto and Schiattarella, Marcello, 2015, Landslide inventory map of the upper Sinni River valley, Southern Italy,
Journal of maps (2015): 1–10. doi_10.1080/17445647.2014.949313,
DOI: 10.1080%2F17445647.2014.949313
Abstract
In this paper, we present a geomorphological landslide inventory map for an intermountain catchment in ...
In this paper, we present a geomorphological landslide inventory map for an intermountain catchment in the southern Italian Apennines. The study area is seismically active, and it is characterized by high uplift rates produced by Quaternary tectonics. A total of 531 landslides of different types, relative age, and sizes, including some kilometer-scale relict landslides were mapped through the visual interpretation of 1_33,000-scale stereoscopic aerial photographs, and dedicated field surveys. Analysis of the inventory map revealed that recent landslides consist chiefly of reactivations of older landslides, and of the new landslides formed in pre-existing landslide deposits, triggered primarily by intense rainfall events, or prolonged rainfall periods. We expect that the inventory will be used for the evaluation of landslide susceptibility and hazard in the area, and to investigate the long-term geomorphological evolution of a portion of the southern Apennines.
Santangelo M.; Marchesini I.; Cardinali M.; Fiorucci F.; Rossi M.; Bucci F.; Guzzetti F., 2015, A method for the assessment of the influence of bedding on landslide abundance and types,
Landslides (Berl., Print) 12 (2015). doi_10.1007/s10346-014-0485-x,
DOI: 10.1007%2Fs10346-014-0485-x
Abstract
Bedding planes are a known factor that controls the type, abundance and pattern of landslides. ...
Bedding planes are a known factor that controls the type, abundance and pattern of landslides. Where layered rocks crop out, the geometrical relationships between the attitude of the bedding and the geometry of the terrain is crucial to understand landslide phenomena. Obtaining information on bedding attitude for large areas through field surveys is time-consuming, and resource intensive, hampering the possibility of quantitative investigations on the control of bedding planes on landslides. We propose a GIS-based method to extract information on bedding planes from the analysis of information captured through the visual interpretation of stereoscopic aerial photographs and a digital representation of the terrain. We tested the method in the Collazone study area, Umbria, Central Italy, where we used spatially distributed information on beddings and terrain information obtained from a 10 × 10-m DEM to determine morpho-structural domains. We exploited the morpho-structural terrain zonation, in combination with landslide information for the same area, to investigate the role of beddings in controlling the distribution and abundance of landslides in the study area. We found that beddings condition the location and abundance of relict and deep-seated landslides, most abundant in cataclinal slopes, and do not condition significantly the shallow landslides. We expect the method to facilitate the production of maps of morpho-structural domains in layered geological environments. This will contribute to a better understanding of landslide phenomena and to foster the preparation of advanced landslide susceptibility and hazard models. © 2014 Springer-Verlag Berlin Heidelberg.
Alvioli M., Rossi M., Guzzetti F., 2015, Slope stability scaling laws within physically based models and their modifications under varying triggering conditions,
IAEG XII, pp. 547–550, Torino, 15-19 Settembre, 2013,
Abstract
The appearance of scaling phenomena in rainfall-induced landslides has been observed by several
authors, and discussed ...
The appearance of scaling phenomena in rainfall-induced landslides has been observed by several
authors, and discussed within variuos theoretical models. A few properties of landslides are known
to exhibit a power-law functional dependence, as shown by a number of world-wide datasets,
which is often interpreted as a signature of the occurrence of self-organized criticality. We show
that the adoption of a complex, physically motivated model for rainfall infiltration and slope
stability can reproduce fairly well the observations over a wide range of rainfall durations and
intensities, accounting for most of the features exhibited by the datasets in a natural way. Namely,
we reproduce within our approach the observed functional dependencies and the slope of the
scaling laws of intensity-duration triggering thresholds for shallow landslides, and the observed
distribution of landslide sizes. Our approach thus represent a substantial improvement with respect
to simulations performed within simple models where the complexity of the problem is reduced to
very few degrees of freedom. No attempt was made of fine-tuning the large number of physical
parameters characterizing the soil, whose unknown values practically prevent the application of the
model itself as a predicting framework. We conclude that our results corroborate the robustness
of the adopted model, which for the first time is applied over a very large study area partitioned
in many sub-basins, and suggest that it represent a valuable tool to be used in conjunction with
existing statistical approaches for the assessment of the risk associated with the stability of slopes
subject to substantial rainfall activity. Focusing on the intensity/duration dependence of rainfall
thresholds for triggering shallow landslides, we analyze the response of the various sub-basins
for different triggering conditions, and infer the response of the systems under different climatic
scenarios.
Franny Giselle Murillo-García, Irasema Alcántara-Ayala, Francesca Ardizzone, Mauro Cardinali, Federica Fiourucci, Fausto Guzzetti, 2015, Satellite stereoscopic pair images of very high resolution_ a step forward for the development of landslide inventories,
Landslides (Berl., Print) (2015). doi_10.1007/s10346-014-0473-1,
DOI: 10.1007%2Fs10346-014-0473-1
Abstract
Development of landslide inventories based on remote sensing techniques has become one of the main ...
Development of landslide inventories based on remote sensing techniques has become one of the main tools in assessment of hazards and risk. Among those techniques, visual and automatic and semi-automatic analysis of high- and very highresolution (VHR) satellite images, or a combination of these, has recently been considered as a promising way to identify and map landslides at local and regional scales. In this context, a landslide inventory for the municipality of Pahuatlán, Puebla, in central Mexico was prepared by combining three techniques_ (1) visual analysis of stereoscopic pairs of VHR satellite images (GeoEye-1), (2) visual analysis of monoscopic VHR satellite images (SPOT 5 and Google Earth images), and (3) field surveying. In this paper, particular attention is given to landslide identification and mapping based on the GeoEye-1 stereo-pairs. Additionally, as a preliminary step in the use of VHR imagery, a general review is presented of the available VHR satellite images, software and hardware that can be useful for digital mapping of landslides. The landslide inventory included a total of 577 landslides, corresponding to an average density of 10.5 landslides per km2 . Of these, 385 were classified as recent, 171 as old, and 21 as very old, regardless of state of activity. The total mapped area was 54.9km2 ; 57.7% of it had been affected by landsliding. The mean area occupied by recent landslides was of the order of 1,066m2 ; for old landslides, it was 82,559m2 and for very old landslides 1,173,952m2 . Debris flows were the most frequent type of movement (217), followed by 167 translational slides, 97 complex movements, 79 rotational slides, and 17 falls and topples. The cost-benefit relationships of a number of these techniques remain debatable because of the high cost of some of the VHR images and the related software and hardware. However, the appearance of new satellite sensors is likely to generate market competence, so this type of image will probably be available at a much lower cost in the near future. Additionally, it is important to consider that the use of several stereo-high-resolution images involves no cost, as downloading high-resolution images from Google Earth, using Google Earth Pro is currently available. The relative rapidity of these techniques can be highly valuable after a regional landslide disaster has occurred, since damage to roads and infrastructure usually prevents the rapid and accurate evaluation of the impact of landsliding. Most importantly, these techniques can be of great value for hazard evaluation of potentially unstable inhabited slopes.
Rossi M., Torri D., Santi E., Bacaro G., Marchesini I., Mondini A.C., Felicioni G., 2015, Slope Dynamics and Climatic Change Through Indirect Interactions,
Engineering Geology for Society and Territory, edited by Giorgio Lollino , Andrea Manconi, John Clague, Wei Shan, Marta Chiarle, pp. 551–555. CH-6330 Cham (ZG): Springer International Publishing, 2015,