How we map landslides
We recognize landslides through the visual interpretation of aerial photographs, to produce landslide inventory maps
Focus

Internal contact person: Mauro Cardinali
Email: mauro.cardinali@cnr.it

A landslide is the movement of a mass of rock, debris or earth along a slope under the influence of gravity.
Landslides pose serious threats in many areas of the world, and knowing their location, distribution and classification is important for land use planning. Landslide identification and mapping is a fundamental activity for an effective defence from the damage caused by landslides to the population and to structures and the infrastructure.
Interpretation of stereoscopic aerial photographs (aerial photo-interpretation, API) is one of the most common techniques for landslide identification and mapping. API allows to detect subtle topographical variations produced by a landslide, thanks to the three-dimensional view of the topographic surface.
API is an intuitive technique that can be adopted using relatively simple and inexpensive instrumentation, such as a stereoscope (Figure 1). On the other hand, API requires expert operators (photo-interpreters) with a consolidated geological and geomorphological background.
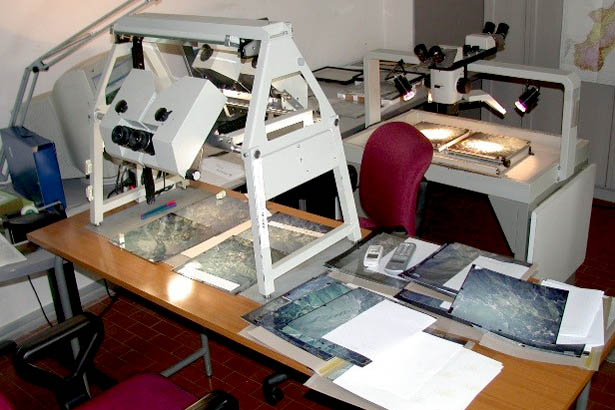
Fig. 1: Stereoscopes room from the IRPI of Perugia
To map landslides, a photo-interpreter uses photographic (tone, texture, pattern), and morphological (shape, size, curvature, slope) and photo-geological (lithology, bedding attitude, structural discontinuities) indicators. Depending on the study area, identification of these indicators can be a relatively simple or very complex operation.
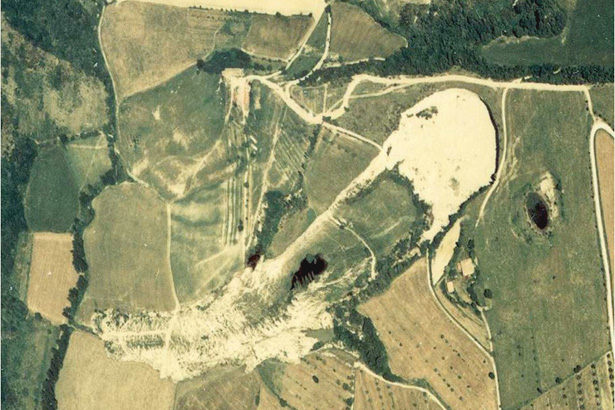
Fig. 2: Aerial photo of a landslide
Analysis of photographic indicators is sufficient to identify and characterize the landslide shown in Figure 2. The light tones are simple to interpret as areas where the vegetation cover was depleted or damaged by the landslide. Road blockages and modifications in the regular pattern of cultivated fields are evident anomalies in the land cover pattern, and evidences of the landslide.
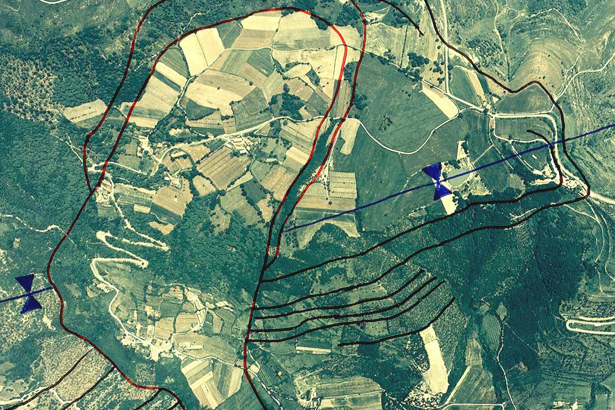
Fig. 3: Aerial photo
On the contrary, landslides similar to the one shown in Figure 3 can only be mapped through the combined analysis of morphologic and photo-geologic indicators. Three-dimensional stereoscopic vision allows the identification of morphologic features such as escarpments, concavities and convexities typical of a landslide. Besides, a photo-geological indicator is represented by the interruption of the lateral continuity of the bedding, which provides a further element for a correct characterization of the landslide.
Donwload attachment