Bossi G., Schenato L., Marcato G., 2016, Data fusion for dissemination_ web applications for the visualization of monitoring data,
Rendiconti online Società Geologica Italiana 39 (2016): 31–34. doi_10.3301/ROL.2016.40,
DOI: 10.3301%2FROL.2016.40
Abstract
A monitoring system with an integrated web platform that has been
installed to control the deformations ...
A monitoring system with an integrated web platform that has been
installed to control the deformations of a road tunnel that intersects a block
slide is presented.
The system has been implemented in order to be redundant, scalable
and providing the possibility to integrate different types of sensors. In fact,
due to the importance of the monitored infrastructure the system needed to
be extremely robust and reliable.
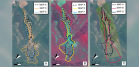
The web platform has been designed focusing on the usability that is
the ease of use and learnability. In fact, when monitoring a landslide or a
structure, displacements are one of the main measured quantities.
However, collected data are usually difficult to communicate with the
classic displacements vs time graphs to local authorities and to the public.
An automatically generated heat maps is available on the platform and the
fact that the most active areas are identified with a reddish color while
lesser movements are indicated in yellow uses a well-known
communication code that helps understanding the dynamic of the process
in a more intuitive way. On the other hand the possibility to have a single
image available on the web to every person involved in the project helps
the dissemination of results and confrontation creating an accessible
common ground in the emergency phase.
Rinaldi M.; Amponsah W.; Benvenuti M.; Borga M.; Comiti F.; Lucia A.; Marchi L.; Nardi L.; Righini M.; Surian N., 2016, An integrated approach for investigating geomorphic response to extreme events_ Methodological framework and application to the October 2011 flood in the Magra River catchment, Italy,
Earth surface processes and landforms (Online) 41 (2016): 835–846. doi_10.1002/esp.3902,
DOI: 10.1002%2Fesp.3902
Abstract
A high-magnitude flash flood, which took place on 25 October 2011 in the Magra River ...
A high-magnitude flash flood, which took place on 25 October 2011 in the Magra River catchment (1717km2),
central-northern Italy, is used to illustrate some aspects of the geomorphic response to the flood. An overall methodological framework
is described for using interlinked observations and analyses of the geomorphic impacts of an extreme event.
The following methods and analyses were carried out_ (i) hydrological and hydraulic analysis of the event; (ii) sediment delivery by
event landslide mapping; (iii) identification and estimation of wood recruitment, deposition, and budgeting; (iv) interpretation of morphological
processes by analysing fluvial deposits; (v) remote sensing and geographic information system (GIS) analysis of channel
width changes.
In response to the high-magnitude hydrological event, a large number of landslides occurred, consisting of earth flows, soil slips,
and translational slides, and a large quantity of wood was recruited, in most part deriving from floodplain erosion caused by bank
retreat and channel widening. The most important impact of the flood event within the valley floor was an impressive widening
of the overall channel bed and the reactivation of wide portions of the pre-event floodplain. Along the investigated (unconfined
or partly confined) streams (total investigated length of 93.5 km), the channel width after the flood was up to about 20 times the
channel width before the event.
The study has shown that a synergic use of different methods and types of evidence provides fundamental information for characterizing
and understanding the geomorphic effects of intense flood events. The prediction of geomorphic response to a flood event is
still challenging and many limitations exist; however a robust geomorphological analysis can contribute to the identification of the
most critical reaches.
Bossi G., Marcato G., 2016, Implementing the Boolean Stochastic Generation method on a 3D model of two convergent landslides.,
X Convegno dei Giovani Ricercatori di Geologia Applicata, Bolgna, 18-19/02/2016,
Abstract
Il metodo BoSG per la modellizazione 3D di due frane convergenti_ un metodo per quantificare ...
Il metodo BoSG per la modellizazione 3D di due frane convergenti_ un metodo per quantificare l'influenza delle semplificazioni del profilo stratigrafico e verificare che la significatività dei risultati sia garantita
Surian, Nicola; Righini, Margherita; Lucía, Ana; Nardi, Laura; Amponsah, William; Amponsah, William; Benvenuti, Marco; Borga, Marco; Cavalli, Marco; Comiti, Francesco; Marchi, Lorenzo; Rinaldi, Massimo; Viero, Alessia, 2016, Channel response to extreme floods_ Insights on controlling factors from six mountain rivers in northern Apennines, Italy,
Geomorphology (Amst.) 272 (2016): 78–91. doi_10.1016/j.geomorph.2016.02.002,
DOI: 10.1016%2Fj.geomorph.2016.02.002
Abstract
This work addresses the geomorphic response of mountain rivers to extreme floods, exploring the relationships ...
This work addresses the geomorphic response of mountain rivers to extreme floods, exploring the relationships between morphological changes and controlling factors. The research was conducted on six tributaries of the Magra River (northern Apennines, Italy) whose catchments were affected by an extreme flood (estimated recurrence interval. >. 100. years in most of the basins) on 25 October 2011. An integrated approach was deployed to study this flood, including (i) analysis of channel width changes by comparing aerial photographs taken before and after the flood, (ii) estimate of peak discharges in ungauged streams, (iii) detailed mapping of landslides and analysis of their connectivity with the channel network.Channel widening occurred in 35 reaches out of 39. In reaches with channel slope<4% (here defined as nonsteep reaches), average and maximum ratios of post-flood and pre-flood channel width were 5.2 and 19.7 (i.e., channel widened from 4 to 82m), respectively. In steep reaches (slope>=4%), widening was slightly less intense (i.e., average width ratio=3.4, maximum width ratio=9.6). The relationships between the degree of channel widening and seven controlling factors were explored at subreach scale by using multiple regression models. In the steep subreaches characterized by higher confinement, the degree of channel widening (i.e., width ratio) showed relatively strong relationships with cross-sectional stream power, unit stream power (calculated based on pre-flood channel width), and lateral confinement, with coefficients of multiple determination (R 2) ranging between 0.43 and 0.67. The models for the nonsteep subreaches provided a lower explanation of widening variability, with R 2 ranging from 0.30 to 0.38; in these reaches a significant although weak relation was found between the degree of channel widening and the hillslope area supplying sediment to the channels.Results indicate that hydraulic variables alone are not sufficient to satisfactorily explain the channel response to extreme floods, and inclusion of other factors such as lateral confinement is needed to increase explanatory capability of regression models. Concerning hydraulic variables, this study showed that the degree of channel widening is more strongly related to unit stream power calculated based on pre-flood channel width than to cross-sectional stream power and to unit stream power calculated with post-flood channel width. This could suggest that most width changes occurred after the flood peak. Finally, in terms of hazard, it is crucial to document the type and magnitude of channel changes, to identify controlling factors, and most importantly, to develop tools enabling us to predict where major geomorphic changes occur during an extreme flood.
Bucci F.; Santangelo M.; Cardinali M.; Fiorucci F.; Guzzetti F., 2016, Landslide distribution and size in response to Quaternary fault activity_ The Peloritani Range, NE Sicily, Italy,
Earth surface processes and landforms (Online) (2016). doi_10.1002/esp.3898,
DOI: 10.1002%2Fesp.3898
Abstract
[object Object] ...
[object Object]
S. Cucchiaro, M. Cavalli, A. De Luca, L. Marchi, F. Cazorzi, 2016, Uso di dati LiDAR aereo e terrestre per la modellazione della dinamica del sedimento,
BIOGRAFIA DI UN'IDEA: L'insegnamento di Salvatore Puglisi e l'attualità delle Sistemazioni Idraulico-Forestali, pp. 27–27, Bari, 8-9/2/2016,
Abstract
La disponibilità di dati topografici e morfometrici ad alta risoluzione non è più un problema, ...
La disponibilità di dati topografici e morfometrici ad alta risoluzione non è più un problema, soprattutto dopo la
diffusa adozione delle tecnologie di rilievo con scansione laser. Tuttavia, a questa abbondanza di dati spesso non fanno
seguito tecniche e procedure adeguate per elaborarli e trasformarli in informazioni utili per la gestione dei bacini
idrografici. Risulta in particolare ancora necessario definire strategie universali e protocolli condivisi per attuare la
fusione dei dati provenienti da fonti diverse (quali cartografia numerica, scansioni laser, fotogrammetria digitale) per
produrre modelli digitali del terreno (DTM) caratterizzati, oltre che da una altissima risoluzione (inferiore al metro),
anche dalla possibilità di un frequente aggiornamento nelle porzioni interessate dalla dinamica dei processi torrentizi e
di versante. Il lavoro che presentiamo qui è stato finalizzato a valorizzare dati morfometrici ad alta risoluzione raccolti
utilizzando due diverse tecnologie, vale a dire Laser Scanner Aereo (ALS) e Laser Scanner Terrestre (TLS). Le due
diverse tipologie di dato sono state combinate per generare una serie di DTM per valutare gli effetti della costruzione di
una nuova briglia sulla dinamica del sedimento in un piccolo bacino di montagna (Rio Moscardo).
La fusione dei due set di dati ha permesso di generare tre DTM. Il primo DTM (scenario 1, solo dati ALS) descrive
la morfologia prima della costruzione della briglia. Il secondo DTM (scenario 2, a partire dai dati ALS e TLS) descrive
la morfologia subito dopo la costruzione della briglia, quindi senza deposito di detrito a monte. Il terzo DTM (scenario
3, da ALS e TLS, modificato) descrive la morfologia pochi anni dopo la costruzione della briglia, con consistente
deposito di sedimento a monte dell'opera. I tre DTM sono stati utilizzati come base per il calcolo di un indice di
connettività (IC) del sedimento, per valutare come le diverse porzioni del bacino siano collegate alla sezione di chiusura
(target) in termini di trasporto. I risultati mostrano chiaramente la capacità dell'indice proposto nel rappresentare le
variazioni della connettività del sedimento in seguito alla costruzione ed al successivo riempimento di una briglia di
trattenuta. Nella modellizzazione dello scenario 2 la briglia agisce come un "sink", trattenendo il detrito e scollegando
la porzione bacino a monte della diga (15% del bacino) dalla sezione di chiusura. Nello scenario 3, dove, nonostante la
pendenza della zona appena a monte della briglia sia fortemente diminuita a causa di deposito di sedimento, i valori di
IC della porzione di bacino sottesa dalla briglia tornano prossimi a quelli mostrati nello scenario 1, con una decisa
connessione alla sezione di chiusura.
T. Caloiero, B. Sirangelo, R. Coscarelli, E. Ferrari, 2016, An Analysis of the Occurrence Probabilities ofWet and Dry Periods through a Stochastic Monthly Rainfall Model,
Water (Basel) 8 (2016): 39/1–39/21. doi_10.3390/w8020039,
DOI: 10.3390%2Fw8020039
Abstract
Stochastic simulators can effectively generate the intrinsic variability of the rainfall process, which is an ...
Stochastic simulators can effectively generate the intrinsic variability of the rainfall process, which is an important issue in the analysis of the projections uncertainties. In this paper, a procedure for stochastic modeling of precipitation at monthly scale is proposed. The model adopts variable transformations, which are finalized to the deseasonalization and the Gaussianization of the monthly rainfall process, and includes a procedure for testing the autocorrelation. The model was applied to a homogeneous database of monthly rainfall values registered in 12 rain gauges in the region of Calabria (Southern Italy). After the estimation of the model parameters, a set of 10^4 years of monthly rainfall for each rain gauge was generated by means of a Monte Carlo technique. Then, dry and wet periods were analyzed through the application of the standardized precipitation index (SPI).
Some results, confirmed through the application of the drought severity index (DSI), showed that the proposed model provided a good representation of the monthly rainfall for the considered rain gauges. Moreover, the results of the SPI application indicate a greater probability of dry conditions than wet conditions, especially when long-term precipitation patterns are considered.
Marco Donnini (a,d), Francesco Frondini (a), Jean-Luc Probst (b,c), Anne Probst (b,c), Carlo Cardellini (a), Ivan Marchesini (d), Fausto Guzzetti (d), 2016, Chemical weathering and consumption of atmospheric carbon dioxide in the Alpine region,
Global and planetary change (Print) 136 (2016): 65–81. doi_10.1016/j.gloplacha.2015.10.017,
DOI: 10.1016%2Fj.gloplacha.2015.10.017
Abstract
To determine the CO2 consumption due to chemical weathering in the Alps, water samples from ...
To determine the CO2 consumption due to chemical weathering in the Alps, water samples from the 32 main Alpine rivers were collected and analysed in two periods, spring 2011 and winter 2011/2012. Most of the river waters are characterized by a bicarbonate earth-alkaline composition with some samples showing a clear enrich- ment in sulphates and other samples showing a slight enrichment in alkaline metals. The amount of total dissolved solids (TDS) ranges between 96 and 551 mg/L. Considering the major ion composition and the Sr isotopic composition of water samples, coherently with the geological setting of the study area, three major reservoirs of dissolved load have been recognized_ carbonates, evaporites and silicates. Based on a chemical mass balance, the flux of dissolved solids, and the flux of carbon dioxide consumed by chemical weathering have been computed for each basin and for the entire study area. Results show that the flux of dissolved solids, ranges from 8 × 10³ to 411 × 103 kg km-2 y-1, with an average value of 127 × 103 kg km-2 y-1, while the flux of carbon dioxide consumed by chemical weathering in the short-term (b 1 Ma) is 5.03 × 10⁵ mol km- 2 y- 1 1 on average. Since part of the CO2 is returned to the atmosphere through carbonate precipitation and reverse weathering once river water reaches the ocean, the CO2 removed from the atmosphere/soil system in the long-term (N 1 Ma) is much smaller than the CO2 consumed in the short-term and according to our calculations amounts to 2.01 × 10⁴ mol km- 2 y- 1 on average. This value is almost certainly a minimum estimate of the total amount of CO2 fixed by weathering on the long-term because in our calculations we assumed that all the alkaline metals deriving from rock weathering in the continents are rapidly involved in the process of reverse weathering in the oceans, while there are still large uncertainties on the magnitude and significance of this process. The values of CO2 flux consumed by weathering are strongly correlated with runoff while other potential controlling factors show only weak correlations or no correlation. Our estimation of the CO2 consumed by weathering in the Alpine basins is in the same order of magnitude, but higher than the world average and is consistent with previ- ous estimations made in river basins with similar climatic conditions and similar latitudes.
A. Longobardi, G. Buttafuoco, T. Caloiero, R. Coscarelli, 2016, Spatial and temporal distribution of precipitation in a Mediterranean area (southern Italy),
Environmental earth sciences (Print) 75 (2016): 189/1–189/20. doi_10.1007/s12665-015-5045-8,
DOI: 10.1007%2Fs12665-015-5045-8
Abstract
The precipitation climate regime of a region is characterized by the distribution of the monthly ...
The precipitation climate regime of a region is characterized by the distribution of the monthly precipitation contribution. Its temporal and spatial analysis is particularly interesting for many fields of applied sciences, such as climatology, hydrology and water resources management. With the aim to describe the climate regime, its spatial feature and relevant potential temporal shift, for a large area of southern Italy (Mediterranean basin), a database of about 559 stations has been explored through the statistical analysis of rainfall time series spanning between 1917-2006. After a change point analysis, aimed at the assessment of data quality, a trend analysis has been performed on both monthly precipitation, monthly percentage of annual rainfall amount and PCI-computed series. The broad extension of the area under investigation highlights a better understanding of precipitation distribution patterns over space. Results of PCI trend analysis show a significant shift, for about 40%-50% of total gauging station, over the time toward a more uniform climate regime, especially for the hilly areas. Moreover, the trend analysis on the monthly rainfall series indicate that the shift is produced by a reduction of rainfall amount during the winter season, particular consistent over the Tyrrhenian side of the peninsula, and an increase during the summer season quite widespread over the whole investigated territory.
Latutrie, B.a, Andredakis, I.b, De Groeve, T.b, Harris, A.J.L.a , Langlois, E.c, Van Wyk de Vries, B.a, Saubin, E.a, Bilotta, G.d, Cappello, A.d, Crisci, G.M.e, D'ambrosiofg, Del Negro, C.d, Favalli, M.h, Fujita, .i,
Iovine, G.g, Kelfoun, K.a, Rongo, R.fg, Spataro, W.fg, Tarquini, S.h, Coppola, D.j, Ganci, G.d, Marchese, F.k, Pergola, N.k, Tramutoli, V.l, 2016, Testing a geographical information system for damage and evacuation assessment during an effusive volcanic crisis,
Detecting, Modelling and Responding to Effusive Eruptions, edited by Harris, A., De Groeve, T., Garel, F., & Carn, S.A., pp. 649–672. Bath_ Geological Society Publishing House, 2016,
Abstract
Using two hypothetical effusive events in the Chaine des Puys (Auvergne, France), we
tested two geographical ...
Using two hypothetical effusive events in the Chaine des Puys (Auvergne, France), we
tested two geographical information systems (GISs) set up to allow loss assessment during an effusive
crisis. The first was a local system that drew on all immediately available data for population,
land use, communications, utility and building type. The second was an experimental add-on to the
Global Disaster Alert and Coordination System (GDACS) global warning system maintained by
the Joint Research Centre (JRC) that draws information from open-access global data. After defin-
ing lava-flow model source terms (vent location, effusion rate, lava chemistry, temperature, crystallinity
and vesicularity), we ran all available lava-flow emplacement models to produce a
projection for the likelihood of impact for all pixels within the GIS. Next, inundation maps and
damage reports for impacted zones were produced, with those produced by both the local system
and by GDACS being in good agreement. The exercise identified several shortcomings of the systems,
but also indicated that the generation of a GDACS-type global response system for effusive
crises that uses rapid-response model projections for lava inundation driven by real-time satellite
hotspot detection - and open-access datasets - is within the current capabilities of the community.
ROCCO RONGO (1), VALERIA LUPIANO (2), WILLIAM SPATARO (1), DONATO D'AMBROSIO (1), GIULIO IOVINE (3), AND GINO CRISCI (2), 2016, SCIARA: Cellular Automata Lava flow modelling and applications in hazard prediction and mitigation,
Detecting, Modelling and Responding to Effusive Eruptions, edited by Harris, A., De Groeve, T., Garel, F., & Carn, S.A., pp. 345–356. Bath_ Geological Society Publishing House, 2016,
Abstract
The use of thematic volcanic hazard maps is essential for policy managers and administrators
in land ...
The use of thematic volcanic hazard maps is essential for policy managers and administrators
in land use planning and to determine the best form of action during emergencies. In particular,
hazard maps are a key tool in emergency management and are used to describe the threat
expected at a certain location in the event of future eruptions. We applied the latest version of
the SCIARA lava flow cellular automata model using parallel computing through general purpose
graphics processing units technology to derive lava flow hazard maps for Mt Etna, Sicily. The
methodology relies on an accurate analysis of the past behaviour of the volcano and is appropriate
for land use planning and civil defence applications.
F. Antonioli (a), V. Lo Presti( b, a), , A. Rovere (c, d), L. Ferranti (e), M. Anzidei (f), S.Furlani (g), G.Mastronuzzi (h), P. E. Orru (i), G.Scicchitano (j), G. Sannino (a), C. R. Spampinato (k), R. Pagliarulo (l), G. Deiana (i), E. de Sabata (m), P. Sansò ( n), M. Vacchi (o), A. Vecchio (f), 2016, Reply to comment by Evelpidou N. and Pirazzoli P. on “Tidal Notches in the Mediterranean sea_ A comprehensive analysis”,
Quaternary science reviews 131 (2016): 238–241. doi_10.1016/j.quascirev.2015.09.026,
DOI: 10.1016%2Fj.quascirev.2015.09.026
Abstract
We take the chance offered by the comment of Evelpidou and Pirazzoli (2015a) to our ...
We take the chance offered by the comment of Evelpidou and Pirazzoli (2015a) to our paper (Antonioli et al., 2015) to clarify some aspects of our work. We reinforce our statement that a present-day tidal notch is almost continuously developed along much of the central Mediterranean coast.
Polemio M., De Giorgio G., 2016, Geodatabase degli acquiferi costieri carbonatici ionico-adriatici,
SP3_LI5_WP1_AZ2_UO16_D02, 2016,
Abstract
Documento di sintesi relativo al GeoDatabase del Progetto RITMARE ...
Documento di sintesi relativo al GeoDatabase del Progetto RITMARE
Massimo Melillo (1), Maria Teresa Brunetti (1), Silvia Peruccacci (1), Stefano Luigi Gariano (1,2), Fausto Guzzetti (1), 2016, Rainfall thresholds for the possible landslide occurrence in Sicily (Southern Italy) based on the automatic reconstruction of rainfall events,
Landslides (Berl., Internet) 13 (2016): 165–172. doi_10.1007/s10346-015-0630-1,
DOI: 10.1007%2Fs10346-015-0630-1
Abstract
Review of the literature on the reconstruction of the rainfall responsible for slope failures reveals ...
Review of the literature on the reconstruction of the rainfall responsible for slope failures reveals that criteria for the identification of rainfall events are lacking or somewhat subjective.
To overcome this problem, we developed an algorithm for the objective and reproducible reconstruction of rainfall events and of rainfall conditions responsible for landslides. The algorithm consists of three distinct modules for (i) the reconstruction of distinct rainfall events, in terms of duration (D, in h) and cumulated event rainfall (E, in mm), (ii) the identification of multiple ED rainfall conditions responsible for the documented landslides, and (iii) the definition of critical rainfall thresholds for possible landslide occurrences. The algorithm uses pre-defined parameters to account for different seasonal and climatic settings. We applied the algorithm in Sicily, southern Italy, using rainfall measurements obtained from a network of 169 rain gauges, and information on 229 rainfall-induced landslides occurred between July 2002 and December 2012. The algorithm identified 29,270 rainfall events and reconstructed 472 ED rainfall conditions as possible triggers of the observed landslides. The algorithm exploited the multiple rainfall conditions to define objective and reproducible empirical rainfall thresholds for the possible initiation of landslide in Sicily. The calculated thresholds may be implemented in an operational early warning system for shallow
landslide forecasting.
Abdolaziz Rahmani a, Saeed Golian b, Luca Brocca c, 2016, Multiyear monitoring of soil moisture over Iran through satellite and reanalysis soil moisture products,
International journal of applied earth observation and geoinformation (2016): in press. doi_10.1016/j.jag.2015.06.009,
DOI: 10.1016%2Fj.jag.2015.06.009
Abstract
Soil moisture (SM) plays a fundamental role for many hydrological applications including water resources, drought ...
Soil moisture (SM) plays a fundamental role for many hydrological applications including water resources, drought analysis, agriculture, and climate variability and extremes. SM is not measured in most parts of Iran and limited measurements do not meet sufficient temporal and spatial resolution. Hence, due to ease of operation, their global coverage and demonstrated accuracy, use of remote sensing SM products is almost the only way for deriving SM information in Iran. In the present research, surface SM (SSM) datasets at six subregions of Iran with different climate conditions were extracted from two satellite-based passive (SMOSL3) and active + passive (ESA CCI SM) microwave observations, and two reanalysis (ERA-Interim and ERA-Interim/Land) products. Time series of averaged monthly mean SSM products and in situ ground precipitation and temperature measurements were derived for each subregion. Results revealed that, generally, all SSM products were in good agreement with each other with correlation coefficients higher than 0.5. The better agreement was found in the Northeast and Southwest region with average correlation values equal to 0.88 and 0.91, respectively. It should be noted that the SSM datasets are characterized by different periods and lengths. Hence, results should be assessed with cautious. Moreover, most SSM products have strong correlations with maximum, minimum and average temperature as well as with total monthly precipitation. Also, trend analysis showed no trend for time series of monthly SSM over all subregions in the two periods 1980-1999 and 2000-2014. The only exceptions were the Southeast subregion for ERA-Interim and Center and Northwest subregions for the ESA CCI SM for which a negative trend was detected for the period 2000-2014. Finally, the Standardized Soil Moisture Index (SSI) calculated from ERA-Interim, ERA-I/Land and ESA CCI SM datasets showed that the Center and Southeast regions suffered from the most severe and longest-lasting drought events in the last decade.
Xiaodong Gao1,2, Xining Zhao1,2,*, Pute Wu1,2, Luca Brocca3, Baoqing Zhang4, 2016, Effects of Large Gullies on Catchment-scale Soil Moisture Spatial Behaviors_ A Case Study on the Loess Plateau of China,
Geoderma (Amst.) 261 (2016): 1–10. doi_10.1016/j.geoderma.2015.07.001,
DOI: 10.1016%2Fj.geoderma.2015.07.001
Abstract
Large gullies which occur globally affect greatly ecohydrological processes in gullied landscape. However, the effects ...
Large gullies which occur globally affect greatly ecohydrological processes in gullied landscape. However, the effects of large gullies on spatial behaviors of soil moisture, a critical ecohydrological variable, at catchment scale are poorly understood. To this end, we conducted spatially intensive soil moisture measurements in the 0-60 cm during the spring, summer and fall of 2010 in the Yuanzegou catchment on the Loess Plateau of China. Statistical and geostatistical analyses showed that the presence of gullies clearly increased the spatial variability in terms of standard deviation (by 26.4% on average), nugget (by several folds) and sill (by 41.3% on average), but had weak effects on spatial means. Particularly, the large gullies also markedly strengthened soil moisture spatial correlations. Slope aspect was shown to be a stronger topographic control than elevation and gradient on soilmoisture spatial variabilitywhether or not gully observationswere included. The role of elevation in soil moisture variability depended on the presence of gullies. As gully observations were included, significant (P < 0.01) and stronger correlations were observed in summer; however, as gully observations were excluded, stronger correlations were found in spring and fall. The presence of gullies increased the required number of samples (N) by 33 to 100% to accurately represent spatial means. A random combination method showed that the effects of sample counts on soil moisture spatial variability were more dependent on gully observations and showed clear seasonality compared with spatial means. This means that both spatial means and spatial variability should be considered for optimizing sampling strategy for gullied topography.
Antronico L., Greco R., Sorriso-Valvo M., 2016, Recent alluvial fans in Calabria (southern Italy),
Journal of maps 12 (2016): 503–514. doi_10.1080/17445647.2015.1047905,
DOI: 10.1080%2F17445647.2015.1047905
Abstract
The present work aims at identifying the location of recent debris-flow dominated alluvial fans at ...
The present work aims at identifying the location of recent debris-flow dominated alluvial fans at a regional scale in Calabria (southern Italy). Here, alluvial fans widely occur as both tributary junction and mountain front types and represent a potential hazard to human settlements and lifelines near or on them. The alluvial fans inventory map on a 1_250 000 scale was obtained by means of a stereoscopic interpretation of aerial photos shot in 1954-1955. To establish the activity of the detected alluvial fans recent documents (scientific reports, local newspapers and journals, internet blogs) on debris flow events and the historical satellite imagery available on Google Earth, covering the period 2001-2014 were analysed. Subsequently, the activity of the alluvial fans over the last 60 years has been divided into four classes. A total of 1170 alluvial fans have been mapped, 545 (46.58 %) of which have been active over the last 60 years. The alluvial fans with a length from apex to toe < 200 m predominate, constituting 70% of the total. In the feeder basins, the dominant lithologies are represented by medium to high-grade metamorphic rocks and igneous rocks, gravel and debris and, shales and low-grade metamorphic rocks. Finally, the inventory map shows that 103 settlements are located on alluvial fans, 18 of which are active or have been active during the last 60 years. This map is a useful tool for land planning policy and for the assessment of risk deriving from debris flows on the alluvial fans of the Calabria region.
Roberto Coscarelli, Tommaso Caloiero, Ivana Minervino, Marino Sorriso-Valvo, 2016, Sensitivity to desertification of a high productivity area in Southern Italy,
Journal of maps 12 (2016): 573–581. doi_10.1080/17445647.2015.1054904,
DOI: 10.1080%2F17445647.2015.1054904
Abstract
Calabria (Southern Italy) is one of the Italian regions most affected by desertification phenomena. This ...
Calabria (Southern Italy) is one of the Italian regions most affected by desertification phenomena. This study presents a detailed analysis of the sensitivity to desertification of an economically important agricultural area in the province of Crotone. The Environmentally Sensitive Areas methodology, developed during the European Union MEDALUS project, has been applied by means of a consistent set of pedological, vegetation, climatic and management data of the study area. Analysis of 15 biophysical and social-economic indicators and an evaluation of 4 Quality Indices allowed the classification of the study area into potential, fragile and critical areas in relation to desertification. The main result is a pronounced sensitivity to desertification of the area_ about 46% of the land emerges as being already affected by degradation phenomena, falling within the worst class ('critical'), while about 39% of the area belongs to the 'fragile' class.
Paranunzio R., Laio F., Chiarle M., Nigrelli G., Guzzetti F., 2016, Climate anomalies associated to the occurrence of rockfalls at high-elevation in the Italian Alps,
Natural hazards and earth system sciences (Online) 16 (2016): 2085–2106. doi_10.5194/nhess-16-2085-2016,
DOI: 10.5194%2Fnhess-16-2085-2016
Abstract
Climate change is seriously affecting the cryosphere, in terms, for example of permafrost thaw, alteration ...
Climate change is seriously affecting the cryosphere, in terms, for example of permafrost thaw, alteration of rain/snow ratio, glacier shrinkage. There is concern about the increasing number of rockfalls at high elevation in the last decades. Nevertheless, the impact of climate variables on slope instability at high elevation has not been fully explored yet. In this paper, we investigate 41 rockfalls occurred at high elevation in the Italian Alps between 1997 and 2013 in the absence of an evident trigger. We apply and improve an existing data-based, statistical approach to detect the anomalies of climate parameters (temperature and precipitation) associated to rockfall occurrences. The identified climate anomalies have been related to the spatio-temporal distribution of the events. Rockfalls occurred in association with temperature anomalies in 83 % of our case studies. Temperature represents a key factor contributing to slope failure occurrence in different ways. As expected, warmer temperatures accelerate snowmelt and permafrost thaw; however, surprisingly, negative anomalies are also often associated to slope failures. Interestingly, different regional patterns emerge from the data_ higher-than-average temperatures are often associated to rockfalls in the Western Alps, while in the Eastern Alps slope failures are mainly associated to colder-than-average temperatures. The results of this study represent a first step towards the identification of the possible role of climate change in the triggering of slope failures in a mountain environment.
Manconi A.; Giordan D., 2016, Landslide failure forecast in near-real-time,
Geomatics, natural hazards & risk (Online) (2016). doi_10.1080/19475705.2014.942388,
DOI: 10.1080%2F19475705.2014.942388
Abstract
We present a new method to achieve failure forecast of landslide phenomena by considering near-real-time ...
We present a new method to achieve failure forecast of landslide phenomena by considering near-real-time monitoring data. Starting from the inverse velocity theory, we jointly analyse landslide surface displacements on different time windows, and apply straightforward statistical methods to obtain confidence intervals on the forecasted time of failure. Our results can be relevant to support the management of early warning systems during landslide emergency conditions, also when the predefined displacement and/or velocity thresholds are exceeded. In addition, our statistical approach for the definition of confidence interval and forecast reliability can be applied also to different failure forecast methods. We applied for the first time the herein presented approach in near-real-time during the emergency scenario relevant to the reactivation of the La Saxe rockslide, a large mass wasting menacing the population of Courmayeur, northern Italy, and the important European route E25. Our results show how the application of simplified but robust forecast models can be a convenient method to manage and support early warning systems during critical situations.
Riccardo Civico, Anna Maria Blumetti , Edi Chiarini , Francesca Romana Cinti, Elena La Posta ,
Felicia Papasodaro , Vincenzo Sapia , Marco Baldo, Giorgio Lollino and Daniela Pantosti., 2016, Traces of the active Capitignano and San Giovanni faults (Abruzzi Apennines, Italy),
Journal of maps (2016).,
Abstract
We present a 1_20,000 scale map of the traces of the active Capitignano and San ...
We present a 1_20,000 scale map of the traces of the active Capitignano and San Giovanni faults
in the area of the Montereale basin (central Apennines, Italy) covering an area of about 80 km2.
Detailed fault mapping is based on high-resolution topography from airborne LiDAR imagery
validated by extensive ground truthing and geophysical prospecting. Our analysis allowed
the recognition of several features related to fault activity, even in scarcely accessible areas
characterized by dense vegetation cover and rugged terrain. The identified fault traces run at
the base of the NW-SE striking Montereale basin-bounding mountain front and along the
base of the southwestern slope of the Monte Mozzano ridge, and have a length of about 12
and 8 km, respectively. Improving the knowledge of fault geometry is a critical issue not only
for the recognition of seismogenic sources but also for surface fault hazard assessment and
for local urban planning. The knowledge of the exact location of the fault traces is also crucial
for the seismogenic characterization of the active faults by means of paleoseismological
trenching.
G. Bossi , L. Borgatti, G. Gottardi, G. Marcato, 2016, The Boolean Stochastic Generation method – BoSG_ A tool for the analysis of the error associated with the simplification of the stratigraphy in geotechnical models,
Engineering geology (Online) 203 (2016): 99–106. doi_10.1016/j.enggeo.2015.08.003,
DOI: 10.1016%2Fj.enggeo.2015.08.003
Abstract
In geotechnical modelling, some minor stratigraphic features are usually discarded in order to simplify the ...
In geotechnical modelling, some minor stratigraphic features are usually discarded in order to simplify the problem, avoiding to deal with further uncertainties about their position, thickness and lateral extent. The study proposes a new method based on the stochastic generation of different soil layers configurations, following a boolean logic_ the material is either matrix or layer (i.e., gravel lenses in a clay-rich matrix).The method has been called BoSG (Boolean Stochastic Generation). The methodology allows to randomize the presence of a specific material interdigitated in a uniform matrix thus enabling to gather a dataset which could be analysed automatically, in order quantify the error associated with the adopted simplification.
The commercial codes FLAC and FLAC3D were used for the geotechnical modelling. A specifically-coded MatLab program allows to generate randomly the different soil configurations and then to automate the computation with the commercial software in order to maximize the sample number.
In this paper the methodology is applied with reference to a simplified slope in 2D and in 3D. Results show that within a low resistance matrix, the presence of layers with higher friction angle can significantly affect significantly the stability and the displacement pattern of an unstable slope. Therefore, a method to investigate the influence of the spatial distribution of these layers can be particularly useful.
L. Brezzi , G. Bossi, F. Gabrieli, G. Marcato, M. Pastor, S. Cola, 2016, A new data assimilation procedure to develop a debris flow run-out model,
Landslides (Berl., Internet) 13 (2016): 1083–1096. doi_10.1007/s10346-015-0625-y,
DOI: 10.1007%2Fs10346-015-0625-y
Abstract
Parameter calibration is one of the most problematic
phases of numerical modeling since the choice of ...
Parameter calibration is one of the most problematic
phases of numerical modeling since the choice of parameters
affects the model's reliability as far as the physical problems being
studied are concerned. In some cases, laboratory tests or physical
models evaluating model parameters cannot be completed and
other strategies must be adopted; numerical models reproducing
debris flow propagation are one of these. Since scale problems
affect the reproduction of real debris flows in the laboratory or
specific tests used to determine rheological parameters, calibration
is usually carried out by comparing in a subjective way only a few
parameters, such as the heights of soil deposits calculated for some
sections of the debris flows or the distance traveled by the debris
flows using the values detected in situ after an event has occurred.
Since no automatic or objective procedure has as yet been produced,
this paper presents a numerical procedure based on the
application of a statistical algorithm, which makes it possible to
define, without ambiguities, the best parameter set. The procedure
has been applied to a study case for which digital elevation models
of both before and after an important event exist, implicating that
a good database for applying the method was available. Its application
has uncovered insights to better understand debris flows
and related phenomena.
M. Alvioli(1), R.L. Baum(2), 2016, Serial and parallel versions of the Transient Rainfall Infiltration and Grid-Based Regional Slope-Stability Model (TRIGRS),
2016,
Abstract
The Transient Rainfall Infiltration and Grid-Based Regional Slope-Stability Model (TRIGRS) is a Fortran program designed ...
The Transient Rainfall Infiltration and Grid-Based Regional Slope-Stability Model (TRIGRS) is a Fortran program designed for modeling the timing and distribution of shallow, rainfall-induced landslides. The program computes transient pore-pressure changes, and attendant changes in the factor of safety, due to rainfall infiltration. The program models rainfall infiltration, resulting from storms that have durations ranging from hours to a few days, using analytical solutions for partial differential equations that represent one-dimensional, vertical flow in isotropic, homogeneous materials for either saturated or unsaturated conditions. This command-line program is used in conjunction with geographic information system (GIS) software to prepare input grids and visualize model results.
This release, 2.1.00a, includes bug fixes, new output formats, and various optimizations to improve performance of the serial code. These improvements have also been incorporated into a new parallel implementation of the TRIGRS program. We have parallelized the four time-demanding execution modes of TRIGRS, namely both the saturated and unsaturated model with finite and infinite soil depth options, within the Message Passing Interface (MPI) framework. Performance gain with respect to the serial code was tested both on commercial hardware and on a high-performance multi-node machine. We also compared results of the parallel code against results of the serial code for a large study area in Colorado to verify accuracy of the results. Modifications to the code and results of the performance tests are described in an interpretive paper in the journal Environmental Modeling & Software (Alvioli and Baum, 2016).
Baroni C. [1], Bondesan A.[2], Mortara G.[3], 2015, REPORT OF THE GLACIOLOGICAL SURVEY 2014,
Geografia fisica e dinamica quaternaria (Testo stamp.) 38 (2015): 229–304. doi_10.44161/GFDQ.2015.38.18,
DOI: 10.44161%2FGFDQ.2015.38.18
Abstract
In the reports the following rules and conventions were observed.
The numbers in bold type preceding ...
In the reports the following rules and conventions were observed.
The numbers in bold type preceding the name of the glaciers
are those of the «Catasto dei Ghiacciai Italiani» (Inventory of Italian Glaciers), 4 voll., Comitato Glaciologico Italiano, 1959-1962,
and subsequent variations. The numbers in bold type that countermark photographs and figures correspond to those of the glacier
inventory. In addition to the subject, the photographic station, the
date and the author are also indicated.
The letters, sometime in pairs, between brackets and small,
placed next to the symbols of the signals, have the following meaning_ c, centre; d, right; s, left; f, frontal; l, lateral. The symbols (C),
(T) and (A) indicate that the altitude they refer to, always expressed
in metres, has been respectively derived from the topographical
map, determined topographically or obtained with an altimeter.
In the tables summarising the variations of each glacier the
distances, expressed in metres, are approximated to ±0.5 m and
are intended as real distances. Unless otherwise indicated in
brackets, previous distance means that of the year 2013. Variations are indicated with the following symbols_ - retreat; +
advance; -X not quantifiable retreat; +X not quantifiable advance,
0 stationary glacier; ? uncertain variation; SN snout covered by
residual snow; NM not measured.
The coordinators assume both scientific and editorial responsibility for all reports in the sectors within their competence.
Antronico, Loredana; Borrelli, Luigi; Coscarelli, Roberto; Gullà, Giovanni, 2015, Time evolution of landslide damages to buildings_ the case study of Lungro (Calabria, southern Italy),
Bulletin of engineering geology and the environment (Print) 74 (2015): 47–59. doi_10.1007/s10064-014-0591-y,
DOI: 10.1007%2Fs10064-014-0591-y
Abstract
In the last decades, building damage caused by landslides in urban areas has increased due ...
In the last decades, building damage caused by landslides in urban areas has increased due to the rapid growth of urbanization even on landslide-prone slopes. This work presents the analysis results of landslide damage evolution by means of a macrodamage index in relation to the characteristics of landslides. The study area is located in southern Italy, and is affected by slow-moving landslides, which, over time, have caused relevant effects on the buildings. A series of geological and geomorphological studies and field surveys, supported by monitoring via conventional geotechnical techniques, allowed us to classify four categories of landslides based on the following criteria_ landslide movement, type of material and estimated depth. Detailed field surveys aimed at evaluating distribution and evolution of the damage to buildings located within and near the unstable area were carried out in 2005 and 2011. The evaluation of the macrodamage index in two different years enabled us to directly correlate the features of the landslide categories and their effects on the urban fabric.
Coviello, V.; Arattano, M.; Turconi, L., 2015, Detecting torrential processes from a distance with a seismic monitoring network,
Natural hazards (Dordr.) 78 (2015): 2055–2080. doi_10.1007/s11069-015-1819-2,
DOI: 10.1007%2Fs11069-015-1819-2
Abstract
The detection of debris flows through seismic devices occurs at a certain distance from the ...
The detection of debris flows through seismic devices occurs at a certain distance from the channel bed. Ground vibration detectors are installed outside of the flow path, usually along the banks of the torrent or on the surrounding valley slopes, in order to avoid damage or even complete destruction. Seismic networks, however, are also prone to detect other earth surface processes that can be confused with the passage of a debris flow. Recognizing these other processes is important, particularly when the seismic network is used for warning purposes and not only for monitoring. To this aim, two seismic networks were installed in two instrumented basins located in the Italian Alps. Both networks were designed for debris flow monitoring purposes and for testing warning algorithms. In this paper, the seismic recordings of torrential processes that occurred at different distance from the monitoring networks, within and outside the monitored channels, are presented and discussed. It was found that knowledge of the waveform that these different processes produce is critical to the successful design and implementation of seismic networks for debris flow warning.
Ivan Marchesini, Mauro Rossi, Silvia Peruccacci, Massimo Melillo, 2015, Monitoring_local_rainfall_threshold,
2015,
Abstract
Descrizione: Il codice sviluppato intregra_
- un modulo di acquisizione e lo storage di ...
Descrizione: Il codice sviluppato intregra_
- un modulo di acquisizione e lo storage di dati pluviometrici, da singoli pluviometri, a alta risoluzione temporale
- un modulo per l'analisi dei dati in relazione alle soglie di innesco di frane pluvioindotte
- un modulo per la restituzione di bollettini periodici e di messaggi di allerta al superamento di determinate soglie di pioggia cumulata.
Il software è stato sviluppato e applicato nell'ambito di una convenzione tra il Commissario delegato per fronteggiare l'emergenza idrica nella Città di Messina e l'Istituto di Ricerca per la Protezione Idrogeologica (CNR IRPI). Il software è stato sviluppato integrando librerie Open Source in ambiente GNU-Linux
Mauro Rossi
Ivan Marchesini, 2015, Potenziamento sistemistico del sistema d’allertamento nazionale per la possibile occorrenza di fenomeni franosi indotti da piogge (SANF) e Disegno e implementazione di sistemi di allertamento per la previsione di fenomeni franosi a scala regionale (SARF),
Versione 1.0 31 dicembre 2015, 2015,
Abstract
Il documento illustra le attività realizzate nel corso del 2015 nell'ambito dell'Accordo di
Collaborazione (AC) tra ...
Il documento illustra le attività realizzate nel corso del 2015 nell'ambito dell'Accordo di
Collaborazione (AC) tra il Dipartimento della Protezione Civile (DPC) e il Centro di
Competenza dell'Istituto di Ricerca per la Protezione Idrogeologica (CC IRPI), del
Consiglio Nazionale delle Ricerche (CNR) [DA-008]. Le attività previste dal presente AC
si inquadrano nell'ambito dell'Accordo di Programma Quadro firmato dal Capo del
Dipartimento della Protezione Civile della Presidenza del Consiglio dei Ministri, e dal
Presidente del Consiglio Nazionale delle Ricerche [DA-002].
Le attività oggetto del presente AC riguardano la manutenzione e lo sviluppo del Sistema
di Allertamento Nazionale per la previsione del possibile innesco di fenomeni Franosi
indotti da piogge (SANF). In particolare le attività descritte nel presente rapporto hanno
riguardato il potenziamento sistemistico di SANF e il disegno e implementazione di
sistemi di allertamento per la previsione di fenomeni franosi a scala regionale.
Il documento è suddiviso in 5 capitoli. Il Capitolo 1 contiene un'introduzione ai contenuti
del documento. Nel Capitolo 2 sono è descritto il potenziamento sistemistico e la struttura
del nuovo sistema SANF. Il Capitolo 3 descrive le specifiche modifiche per l'esportazione
del sistema a scala regionale. Il Capitolo 4 riporta le attività di modifica a livello di sistema
utili in sede di validazione delle previsioni SAN. Il Capitolo 5 contiene l'elenco della
bibliografia di riferimento.
Ivan Marchesini, Mauro Rossi, B.D.Malamud, 2015, LAMPRE – D.7 .2. HANDBOOK FOR SW INSTALLATION AND RUNNING,
2015,
Abstract
This report is the Deliverable 7.2 of the LAMPRE project "Handbook for the installation and ...
This report is the Deliverable 7.2 of the LAMPRE project "Handbook for the installation and running of SW tools for regional susceptibility modelling and the determination of the statistic of landslide size".
The software, their logical scheme, the interfaces and the relative input and outputs are described in this report. The document contains a user guide describing how to install and use the two software and gives specifications on the operational software modes.
The prototype software for determination of landslide statistics from inventory maps (LStats) was designed and developed in the Task 5.3 in the framework of LAMPRE project, while that for the regional landslide susceptibility modelling and zonation in Task 6.2.
The first software is described in the sections from 1 to 4, the second from section 5 to 8. Sections 1, 2 and 5 introduce the software, while section 4 and 8 contain specific information on the installation and running procedures.
Schenato, L., 2015, Business Development Support at OFS 2015,
2015,
Abstract
Questo rapporto contiene i risultati final del contratto di Business Development Support for Optical ...
Questo rapporto contiene i risultati final del contratto di Business Development Support for Optical Phase Interrogator, stipulato tra CNR-IRPI and Avago (sottoposto ad accordo di non divulgazione)
Simone Sterlacchini, Marco Zazzeri, Paola Salvati, Ivan Marchesini, Mauro Rossi, Marco Donnini, 2015, Modelli di valutazione dell’esposizione e del danno idrologico,
RII.I, 2015,
Abstract
Le attività scientifiche relative al II anno del progetto GENERALI intendono incrementare, partendo dalle
mappe della ...
Le attività scientifiche relative al II anno del progetto GENERALI intendono incrementare, partendo dalle
mappe della pericolosità (recanti le informazioni relative ai tiranti idrici e ai tempi di ritorno degli eventi
attesi), il livello informativo contenuto negli scenari di rischiodi alluvione. Questo avvieneesplicitando non
solo l'esposizione (in termini di numero e valore degli edifici a uso residenziale e industriale) ma anche una
quantificazione del danno diretto atteso in termini di costo di costruzione/ricostruzione considerando solo
le abitazioni ad uso civile.
Dott. Ivan Marchesini
Dott. Mauro Rossi
Ing. Silvia Peruccacci
Dott.ssa Maria Teresa Brunetti, 2015, CC-DPC – PROCEDURA PER LA GENERAZIONE DI UN BOLLETTINO DI MONITORAGGIO PLUVIOMETRICO PER LA POSSIBILE OCCORRENZA DI FENOMENI FRANOSI INDOTTI DA PIOGGE,
2015,
Abstract
Il documento illustra le attività realizzate nel corso del 2015 nell'ambito dell'Accordo di
Collaborazione (AC) tra ...
Il documento illustra le attività realizzate nel corso del 2015 nell'ambito dell'Accordo di
Collaborazione (AC) tra il Dipartimento della Protezione Civile (DPC) e il Centro di
Competenza dell'Istituto di Ricerca per la Protezione Idrogeologica (CC IRPI), del
Consiglio Nazionale delle Ricerche (CNR) [DA-008]. Le attività previste dal presente AC
si inquadrano nell'ambito dell'Accordo di Programma Quadro firmato dal Capo del
Dipartimento della Protezione Civile della Presidenza del Consiglio dei Ministri, e dal
Presidente del Consiglio Nazionale delle Ricerche [DA-002].
Le attività oggetto del presente AC riguardano la manutenzione e lo sviluppo del
Sistema di Allertamento Nazionale per la previsione del possibile innesco di fenomeni
Franosi indotti da piogge (SANF). In particolare le attività descritte nel presente rapporto
riguardano la progettazione di un sistema per la generazione di un bollettino per il
possibile innesco di fenomeni franosi indotti da piogge.
Il documento è suddiviso in due capitoli. Il Capitolo 1 descrive le procedure per la
generazione in automatico di bollettini di monitoraggio pluviometrico per la previsione
della possibile occorrenza di fenomeni franosi indotti da piogge. Il Capitolo 2 contiene
l'elenco della bibliografia di riferimento.
Dott. Ivan Marchesini
Dott. Mauro Rossi, 2015, CC-DPC – POTENZIAMENTO OPERATIVO DEL SISTEMA D’ALLERTAMENTO NAZIONALE PER LA POSSIBILE OCCORRENZA DI FENOMENI FRANOSI INDOTTI DA PIOGGE SANF,
2015,
Abstract
Il documento illustra alcune delle attività realizzate nel corso del 2015 nell'ambito
dell'Accordo di Collaborazione (AC) ...
Il documento illustra alcune delle attività realizzate nel corso del 2015 nell'ambito
dell'Accordo di Collaborazione (AC) tra il Dipartimento della Protezione Civile (DPC) e il
Centro di Competenza dell'Istituto di Ricerca per la Protezione Idrogeologica (CC IRPI),
del Consiglio Nazionale delle Ricerche (CNR) [DA-008]. Le attività previste dal presente
AC si inquadrano nell'ambito dell'Accordo di Programma Quadro firmato dal Capo del
Dipartimento della Protezione Civile della Presidenza del Consiglio dei Ministri, e dal
Presidente del Consiglio Nazionale delle Ricerche [DA-002].
Le attività oggetto del presente AC riguardano la manutenzione e lo sviluppo del
Sistema di Allertamento Nazionale per la previsione del possibile innesco di fenomeni
Franosi indotti da piogge (SANF). In particolare le attività descritte nel presente rapporto
riguardano il potenziamento operativo del sistema.
Il documento descrive la nuova dashboard di SANF e in particolare le due interfacce di
monitoraggio e di catalogo.
Marchesini, Ivan; Santangelo, Michele; Guzzetti, Fausto; Cardinali, Mauro; Bucci, Francesco, 2015, Modeling Morpho-Structural Settings Exploiting Bedding Data Obtained Through the Interpretation of Stereoscopic Aerial Photographs,
5th International Symposium on Geotechnical Safety and Risk, pp. 797–802, Rotterdam, 13/10/2015 - 16/10/2015,
Abstract
Landslide abundance is controlled by multiple factors, including the presence and attitude of beddings, foliation, ...
Landslide abundance is controlled by multiple factors, including the presence and attitude of beddings, foliation, faults, joints and cleavage systems. Few attempts were made to exploit bedding attitude (BA) data (or data on similar types of rock discontinuities) in statistical or physically based models for regional slope stability analysis. A reason for the lack of applications lays in the complexity of the bedding data, and in the difficulty in the treatment and modelling of circular information. Typically, BA data are collected as point data through field surveys, and suffer from heterogeneity in their spatial distribution. The latter problem is particularly important due to the limited possibility to collect BA data in areas of difficult access. An additional problem lays in the spatial interpolation of the BA data, which are directional data that cannot be interpolated using standard approaches. We build on previous work where we proposed an approach to obtain BA data from bedding traces (BT) i.e., linear signatures of layered rocks on the topographic surface, obtained through the visual interpretation of aerial photographs, and to interpolate the BA data to construct maps showing the geometrical relationship between BA data and slope geometry i.e., maps showing cataclinal, orthoclinal, and anaclinal slopes. In this work, we consider the uncertainties in the definition of the BAs that are used in the production of morpho-structural domain maps, and we investigate the relationships between the morpho-structural domains and landslide abundance in a study area in Umbria, Italy.
Marchesini, Ivan and Mergili, Martin and Schneider-Muntau, Barbara and Alvioli, Massimiliano and Rossi, Mauro and Guzzetti, Fausto, 2015, Physically-based landslide susceptibility modelling_ geotechnical testing and model evaluation issues,
EGU General Assembly 2015, Vienna, 12/04/2015-17/04/2015,
Abstract
We used the software r.slope.stability for physically-based landslide susceptibility modelling in the 90 km2 Collazzone ...
We used the software r.slope.stability for physically-based landslide susceptibility modelling in the 90 km2 Collazzone area, Central Italy, exploiting a comprehensive set of lithological, geotechnical, and landslide inventory data.
The model results were evaluated against the inventory.
r.slope.stability is a GIS-supported tool for modelling shallow and deep-seated slope stability and slope failure probability at comparatively broad scales. Developed as a raster module of the GRASS GIS software,
r.slope.stability evaluates the slope stability for a large number of randomly selected ellipsoidal potential sliding surfaces. The bottom of the soil (for shallow slope stability) or the bedding planes of lithological layers (for
deep-seated slope stability) are taken as potential sliding surfaces by truncating the ellipsoids, allowing for the
analysis of relatively complex geological structures. To take account for the uncertain geotechnical and geometric parameters, r.slope.stability computes the slope failure probability by testing multiple parameter combinations
sampled deterministically or stochastically, and evaluating the ratio between the number of parameter combinations yielding a factor of safety below 1 and the total number of tested combinations. Any single raster cell may be
intersected by multiple sliding surfaces, each associated with a slope failure probability. The most critical sliding
surface is relevant for each pixel.
Intensive use of r.slope.stability in the Collazzone Area has opened up two questions elaborated in the present
work_
(i) To what extent does a larger number of geotechnical tests help to better constrain the geotechnical characteristics of the study area and, consequently, to improve the model results? The ranges of values of cohesion and angle
of internal friction obtained through 13 direct shear tests corresponds remarkably well to the range of values suggested by a geotechnical textbook. We elaborate how far an increased number of tests may help to further improve
the geotechnical parameterization of the model and, consequently, how much effort and resources should be put
into geotechnical sampling and testing for physically-based landslide susceptibility modelling.
(ii) What is the spatial unit most suitable to discretize landslide susceptibility maps? Whilst the GIS pixel is
the most commonly used level of discretization, slope units represent a valid alternative. Tests have shown that
the area under the ROC curve increases significantly when evaluating the slope failure probabilities yielded with
r.slope.stability at the level of slope units instead of pixels. At the level of slope units, the physically-based model
r.slope.stability outperforms statistical models applied to the Collazzone Area. However, there is good reason to
discuss the validity and the usefulness of different levels of discretization.
Marchesini, Ivan and Rossi, Mauro and Balducci, Vinicio and Salvati, Paola and Guzzetti, Fausto and Bianchini, Andrea and Grzeleswki, Emanuell and Canonico, Andrea and Coccia, Rita and Fiorucci, Gianni Mario and others, 2015, High-school software development project helps increasing students’ awareness of geo-hydrological hazards and their risks,
EGU General Assembly 2015, Vienna, 12/04/2015-17/04/2015,
Abstract
In Italy, inundation and landslides are widespread phenomena that impact the population and cause significant ...
In Italy, inundation and landslides are widespread phenomena that impact the population and cause significant economic damage to private and public properties. The perception of the risk posed by these natural geo-hydrological
hazards varies geographically and in time. The variation in the perception of the risks has negative consequences
on risk management, and limits the adoption of effective risk reduction strategies. We maintain that targeted education can foster the understanding of geo-hydrological hazards, improving their perception and the awareness
of the associated risk. Collaboration of a research center experienced in geo-hydrological hazards and risks (CNR
IRPI, Perugia) and a high school (ITIS Alessandro Volta, Perugia) has resulted in the design and execution of a
project aimed at improving the perception of geo-hydrological risks in high school students and teachers through
software development. In the two-year project, students, high school teachers and research scientists have jointly
developed software broadly related to landslide and flood hazards. User requirements and system specifications
were decided to facilitate the distribution and use of the software among students and their peers. This allowed a
wider distribution of the project results. We discuss two prototype software developed by the high school students,
including an application of augmented reality for improved dissemination of information of landslides and floods
with human consequences in Italy, and a crowd science application to allow students (and others, including their
families and friends) to collect information on landslide and flood occurrence exploiting modern mobile devices.
This information can prove important e.g., for the validation of landslide forecasting models
Drobinski P., Ducrocq V., Kotroni V., Lagouvardos K., Ahrens B., Anquetin S., Bouin M.N., Braud I., Coppola E., Coquillat S., Davolio S., Delanoé J., Di Girolamo P., Flamant C., Flaounas E., Fourrié N., Garcia-Moya J., Giordani H., Homar V., Jorda G., Kalthoff N., Khodayar S., Llasat C., Lebeaupin-Brossier C., Michel Y., Morin E., Nuissier O., Petrucci O., Polcher J., Quintana-Segui P., Richard E., Sannino G., Somot S., Testor P., Tramblay Y., Ruin I., Von Schuckmann K., 2015, HyMeX: mid-term program review and perspectives Report of the 9th HyMeX workshop in Mykonos, Greece,
GEWEX news (Online) 27 (2015): 20–22.,
Abstract
The Hydrological Cycle in the Mediterranean Experiment (HyMeX; Drobinski et al., 2014) is a 10-year ...
The Hydrological Cycle in the Mediterranean Experiment (HyMeX; Drobinski et al., 2014) is a 10-year (2010-2020) GEWEX Hydroclimatology Panel (GHP) Regional Hydroclimate Project (RHP). Its objectives are to_ (i) improve the understanding of the water cycle, with emphasis on extreme events, by monitoring and modeling the Mediterranean coupled system (atmosphere-land-ocean), its variability (from the event scale to the seasonal and interannual scales) and characteristics over one decade in the context of global change; and (ii) evaluate societal and economical vulnerability, and adaptation capacity to extreme meteorological and climate events.
olga petrucci, 2015, Effects of floods and landslides on people in a Mediterranean region (Calabria, Italy): victims, injured and involved people,
9th HYMEX Int. Workshop, Mykonos, 25/09/2015,
Abstract
Effects of floods and landslides on people in a Mediterranean region (Calabria, Italy): victims, injured ...
Effects of floods and landslides on people in a Mediterranean region (Calabria, Italy): victims, injured and involved people
olga petrucci, 2015, 5-year science review_ society vulnerabilities facing high-impact weather,
9th HyMeX Workshop, Mykonos, 22/09/2015,
Abstract
The presentation deals with_
FLOODHYMEX DATABASE
Structure and implementation
Limitations and usefulness
THE USES OF FLOODHYMEX DATA
Analysis of ...
The presentation deals with_
FLOODHYMEX DATABASE
Structure and implementation
Limitations and usefulness
THE USES OF FLOODHYMEX DATA
Analysis of Catastrophic Events
Analysis of Transnational Events
THE IMPACT OF EVENTS ON PEOPLE
WORK IN PROGRESS AND FUTURE STEPS
olga petrucci, 2015, Syntesis of the 5-years research activities and results of Hymex science team,
MISTRAL workshop, Marsiglia, 20/10/2015,
Abstract
The presentation try to answer the following question_
?1 How can we monitor adaptation strategies ...
The presentation try to answer the following question_
?1 How can we monitor adaptation strategies to climate change and extreme events in Mediterranean basin?
?2 Which lessons can be learnt from the experience of Mediterranean societies and individuals?
?3 How the other communities can use these lessons?
?4 How to define future scenarios to quantify the impact of global change on extreme events?
?5 How human vulnerability could change due to global change?
olga petrucci, 2015, Databases on damaging geo-hydrological events_ experiences in Mediterranean regions,
JPI-Water Workshop_ Climate impact and loss data for Europe, Berlino, 16/07/2015,
Abstract
Damaging Hydrogeological Events (DHEs or "events").
Damaging Hydrogeological Events in Calabria.
Early and current historical research .
NewASICAL ...
Damaging Hydrogeological Events (DHEs or "events").
Damaging Hydrogeological Events in Calabria.
Early and current historical research .
NewASICAL database.
The FLOODHYMEX database.
PEOPLE_ the database of impact on individuals.
Machado, G.; Lupiano, V.; Avolio, M. V.; Gullace, F.; Di Gregorio, S., 2015, A cellular model for secondary lahars and simulation of cases in the Vascun Valley, Ecuador,
Journal of computational science (Print) 11 (2015): 289–299. doi_10.1016/j.jocs.2015.08.001,
DOI: 10.1016%2Fj.jocs.2015.08.001
Abstract
Cellular Automata (CA) represent a computational paradigm for simulating complex fluid-dynamical phenomena, that evolve on ...
Cellular Automata (CA) represent a computational paradigm for simulating complex fluid-dynamical phenomena, that evolve on the basis of local interactions. Secondary lahars are highly destructive surface flows that originate from the mobilization of pyroclastic deposits by exceptionally heavy rainfalls. CA modelling of rain-induced lahars could be an important tool for risk management in threatened regions. LLUNPIY is a CA model, developed and partially applied on two real events_ the 2005 and 2008 secondary lahars of Vascun Valley, Ecuador. Simulations are satisfying_ a comparison of 2005 event was performed with the two-dimensional model Titan2D and field data, while results of 2008 event were confronted only with field data. (C) 2015 Elsevier B.V. All rights reserved.
Donnini M., Salvati P., Napolitano E., Ardizzone F., Bucci F., Cardinali M., Fiorucci F., Santangelo M., Guzzetti F., 2015, Impact of landslides along road network and direct cost estimation_ two case studies in Central and Southern Italy,
Fourth Italian workshop on landslides, Napoli (Italy), 23-25/10/2015,
Janusz Wasowski(1), Fabio Bovenga(2), Raffaele Nutricato(3), Davide Oscar Nitti(3), Maria Teresa Chiaradia(4), 2015, Satellite interferometry for landslide detection in the peri-Adriatic area,
2nd Regional Symposium on Landslides in the Adriatic-Balkan region, Belgrado (Serbia), 14-16/05/2015,
Abstract
Advanced multi-temporal interferometry (MTI) techniques are being increasingly used in landslide assessment, as they can ...
Advanced multi-temporal interferometry (MTI) techniques are being increasingly used in landslide assessment, as they can provide precise (mm-cm resolution) measurements of very slow ground surface displacements for huge areas with limited vegetation cover. We illustrate the potential of high resolution MTI for wide-area and local-scale detection of slope and associated infrastructure instability hazards in the peri-Adriatic region. This is done by presenting MTI applications to two landslide-prone mountainous areas characterized by different geomorphic, climatic and vegetation conditions, and hence by variable density and distribution of potential radar targets_ the eastern-most part of the Southern Apennines and the mountains in central Albania. The results demonstrate that even in such scarcely urbanized areas MTI can provide valuable information on the presence of slope movements that locally affect small human settlements and road network. The gaps in satellite-derived information, especially evident in the more forested Albanian mountains, suggest that MTI could be most profitably exploited in the reconnaissance stage of a slope hazard assessment, to be followed by more detailed investigation and monitoring of sites at risk.
Janusz WASOWSKI(1), Fabio BOVENGA(2), Raffaele NUTRICATO(3), Davide Oscar NITTI(3), Maria Teresa CHIARADIA(4), Spartak KUCAJ(5) and Boris STRATI(5), 2015, High resolution satellite multi-temporal interferometry for detecting and monitoring landslide and subsidence hazards,
10th Regional Asian Conference of IAEG (2015), Kyoto (Giappone), 26-27/09/2015,
Abstract
With the increasing number of radar satellites and improved data processing tools, multi-temporal interferometry (MTI) ...
With the increasing number of radar satellites and improved data processing tools, multi-temporal interferometry (MTI) can considerably enhance our capabilities of monitoring landslide and subsidence hazards. MTI provides long-term (years), regular (weekly-monthly), precise (mm) measurements of ground displacements over large areas (thousands of km2), combined with high spatial resolution (up to 1-3 m) and possibility of multi-scale (regional to site-specific) investigations using the same series of radar images. To highlight the great potential of high resolution MTI we discuss application examples from two seismically active regions prone to land instability_ i) Albania, including the large plain area occupied by the city of Tirana and nearby scarcely populated mountains, and ii) Haiti, including the Port-au-Prince metropolitan area, with coastal and mountain zones destabilized by the 2010 Mw 7.0 earthquake. It is shown that MTI can provide very useful results in a wide range of geomorphic, climatic and vegetation environments.
48.Wasowski J., Bovenga F., Nutricato R., Nitti D. O., Chiaradia M. T., Guerriero L., 2015, High resolution satellite SAR multi-temporal interferometry for regional scale detection of landslide and subsidence hazards,
4th International Conference on Geomorphometry Geomorphometry 2015_ Conference and Workshops, pp. 181–184, Poznan, Polonia, 22-26/06/2015,
Abstract
Among a number of advanced satellite-based remote sensing techniques, synthetic aperture radar (SAR), multi-temporal interferometry ...
Among a number of advanced satellite-based remote sensing techniques, synthetic aperture radar (SAR), multi-temporal interferometry (MTI) appears the most promising for fostering new research opportunities in landslide and subsidence hazards detection and assessment. MTI is attractive to those concerned with terrain instability hazards because it can provide very precise quantitative information on slow displacements of the ground surface over huge areas with limited vegetation cover. Although MTI is a mature technique, we are only beginning to realize the benefits of the high-resolution imagery that is currently acquired by the new generation radar satellites (e.g. COSMO-SkyMed, TerraSAR-X). In this work we demonstrate the great potential of high resolution MTI for regular, wide-area detection of ground instability hazards by presenting results from two regions characterized by different geomorphic, climatic and vegetation conditions_ densely populated metropolitan area of Port-au-Prince (Haiti), with the coastal areas and local slopes destabilized by the 2010 Mw 7.0 earthquake, and the remote high mountain region of Southern Gansu Province (China) prone to large slope failures. The interpretation and widespread exploitation of high spatio-temporal resolution MTI data can be facilitated by web-based applications (e.g. Google EarthTM tools with the associated high resolution optical imagery).
Nutricato, R.; Nitti, D. O.; Bovenga, F.; Refice, A.; Wasowski, J.; Chiaradia, M. T.; Milillo, G., 2015, COSMO-SkyMed multi-temporal SAR interferometry over liguria region for environmental monitoring and risk management,
IEEE International Geoscience and Remote Sensing Symposium proceedings 2015, pp. 1405–1408, Milano, Italia, 26-31/07/2015,
Abstract
Thanks to the technological maturity as well as to the wide availability of SAR data, ...
Thanks to the technological maturity as well as to the wide availability of SAR data, Multi-temporal SAR Interferometry (MTInSAR) can be used to support systems devoted to environmental monitoring and risk management. In particular, high resolution X-band MTInSAR applications are also suitable for monitoring single man-made structures (buildings, bridges, railways and highways). The paper presents examples concerning the application of MTInSAR techniques and COSMO-SkyMed constellation for instability monitoring of infrastructures and, in particular, harbor docks and railways.
Wasowski, J.; Bovenga, F.; Nutricato, R.; Nitti, D. O.; Chiaradia, M. T., 2015, APPLICATIONS OF MEDIUM C-BAND AND HIGH RESOLUTION X-BAND MULTI-TEMPORAL INTERFEROMETRY IN LANDSLIDE INVESTIGATIONS,
International Conference on Sensors & Models in Remote Sensing & Photogrammetry, pp. 737–743, 23-25/11/2015,
Abstract
With the increasing quantity and quality of the imagery available from a growing number of ...
With the increasing quantity and quality of the imagery available from a growing number of SAR satellites and the improved processing algorithms, multi-temporal interferometry (MTI) is expected to be commonly applied in landslide studies. MTI can now provide long-term (years), regular (weekly-monthly), precise (mm) measurements of ground displacements over large areas (thousands of km(2)), at medium (similar to 20 m) to high (up to 1-3 m) spatial resolutions, combined with the possibility of multi-scale (regional to local) investigations, using the same series of radar images. We focus on the benefits as well as challenges of multi-sensor and multi-scale investigations by discussing MTI results regarding two landslide prone regions with distinctly different topographic, climatic and vegetation conditions (mountains in Central Albania and Southern Gansu, China), for which C-band (ERS or ENVISAT) and X-band COSMO-SkyMed (CSK) imagery was available (all in Stripmap descending mode). In both cases X-band MTI outperformed C-band MTI by providing more valuable information for the regional to local scale detection of slope deformations and landslide hazard assessment. This is related to the better spatial-temporal resolutions and more suitable incidence angles (40 degrees-30 degrees versus 23 degrees) of CSK data While the use of medium resolution imagery may be appropriate and more cost-effective in reconnaissance or regional scale investigations, high resolution data could be preferentially exploited when focusing on urbanized landslides or potentially unstable slopes in urban/peri-urban areas, and slopes traversed by lifelines and other engineering structures.
Caloiero T, Coscarelli R, Ferrari E,, 2015, Trend analysis of mean and extreme rainfall in Calabria (southern Italy),
European Water 52 (2015): 3–12.,
Abstract
A modification in water cycle is one of the most noticeable consequences of global atmospheric ...
A modification in water cycle is one of the most noticeable consequences of global atmospheric warming. Precipitation is a key point in the hydrological process and the distribution of extreme rainfall is particularly important because it may impact on water management, soil erosion and flash floods. In this paper, an analysis of mean and extreme rainfall over a region of southern Italy (Calabria) has been carried using a daily homogeneous rainfall dataset of 129 rain gauges with more than 50 years of observation for the period 1916-2006. First, a statistical analysis was performed through the Mann-Kendall test in order to detect possible trends at annual, seasonal and monthly scale. Then, a set of indices derived from the daily homogeneous rainfall time series was defined and used to examine changes in extreme rainfall through non-parametric techniques. Results show a decreasing trend for annual and winter-autumn rainfall and an increasing trend for summer rainfall. Moreover, a prevailing decreasing trend of the various indices has been detected. These results appear to be in contrast with previous large scale studies which evidenced an increase in extreme rainfall and a decrease in the yearly totals, in other areas of Southern Europe. These differences in the behaviour of extreme rainfall suggest that a detailed regional analysis is always necessary because the distribution of extreme rainfall is often linked to the morphological settings of a territory (proximity to the sea, presence of reliefs, etc.).