Ducci, D.
Polemio, M., 2018, Quantitative Impact of Climate Variations on Groundwater in Southern Italy,
Groundwater and Global Change in the Western Mediterranean Area, edited by Maria Luisa Calvache,Carlos Duque, David Pulido-Velazquez, pp. 101–107, 2018,
Abstract
The variability of precipitation and temperature, the combined effect of which determines a decreasing trend ...
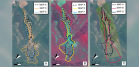
The variability of precipitation and temperature, the combined effect of which determines a decreasing trend of recharge, is critic for groundwater resources due to the overlapping with the increasing exploitation. In Campania, from the eighties to 2008 precipitation has decreased, not uniformly in the whole region; now the trend seems increasing, but this trend is highly influenced by the period 2008-2011, very rainy. In Apulia, the decreasing trend of rainfall is notable after 1980_ the droughts of 1988-92 and 1999-2001 appear to be exceptional. The Apulian piezometric trend of the last 40 years highlights the dramatic decrease of groundwater availability.
This remarkable lowering defines a widespread quantity degradation. The situation severity of groundwater resources is worsened by the effects on the quality of groundwater resources due to the salinization of the wide coastal aquifers of the whole Southern Italy.
Theule J.I.; Crema S.; Marchi L.; Cavalli M.; Comiti F., 2018, Exploiting LSPIV to assess debris-flow velocities in the field,
Natural hazards and earth system sciences (Print) 18 (2018): 1–13. doi_10.5194/nhess-18-1-2018,
DOI: 10.5194%2Fnhess-18-1-2018
Abstract
The assessment of flow velocity has a central role in quantitative analysis of debris flows, ...
The assessment of flow velocity has a central role in quantitative analysis of debris flows, both for the characterization of the phenomenology of these processes and for the assessment of related hazards. Large-scale particle image velocimetry (LSPIV) can contribute to the assessment of surface velocity of debris flows, provided that the specific features of these processes (e.g. fast stage variations and particles up to boulder size on the flow surface) are taken into account. Three debris-flow events, each of them consisting of several surges featuring different sediment concentrations, flow stages, and velocities, have been analysed at the inlet of a sediment trap in a stream in the eastern Italian Alps (Gadria Creek). Free software has been employed for preliminary treatment (orthorectification and format conversion) of video-recorded images as well as for LSPIV application. Results show that LSPIV velocities are consistent with manual measurements of the orthorectified imagery and with front velocity measured from the hydrographs in a channel recorded approximately 70m upstream of the sediment trap. Horizontal turbulence, computed as the standard deviation of the flow directions at a given cross section for a given surge, proved to be correlated with surface velocity and with visually estimated sediment concentration. The study demonstrates the effectiveness of LSPIV in the assessment of surface velocity of debris flows and permit the most crucial aspects to be identified in order to improve the accuracy of debris-flow velocity measurements.
Pagliarulo Rosa, 2018, WP8- D08-01 Relazione Instabilita Costiera Nella Regione Pugliese,
D08-01 WP8, pp.1–24, 2018,
Abstract
Il documento illustra le attività svolte nel 2017 nell'ambito del WP8 dall'Istituto di Ricerca per ...
Il documento illustra le attività svolte nel 2017 nell'ambito del WP8 dall'Istituto di Ricerca per la Protezione Idrogeologica (IRPI), Centro di Competenza (CC) del Dipartimento della Protezione Civile (DPC), nell'ambito del progetto dal titolo "Valutazione integrata di dissesti geo-idrologici nel territorio della regione Puglia, modelli interpretativi dei fenomeni e definizione di soglie di pioggia per il possibile innesco di frane superficiali" per la Sezione Protezione Civile della Regione Puglia.
In particolare, il Report, così' come previsto nella tempistica (diagramma di Gantt) dell'"Allegato Tecnico" ha come oggetto la "Individuazione delle tipologie di costa più frequenti in Puglia". Dopo aver descritto le morfologie più diffuse lungo le coste pugliesi sono stati considerati i fattori che influiscono sui processi morfodinamici e prese in esame le condizioni predisponenti e le cause scatenanti i fenomeni di instabilità che affliggono le coste rocciose alte. Sono state definite le tipologie di instabilità maggiormente interessanti i vari tipi di costa.
Ardizzone F., Fiorucci F., Mondini A.C., Guzzetti F., 2018, TXT-tool 1.039-1.1: Very-High Resolution Stereo Satellite Images for Landslide Mapping,
, pp. 83–94, 2018,
Abstract
Il capitolo rappresenta un "teaching tool" , uno strumento educativo volto ad insegnare un metodo ...
Il capitolo rappresenta un "teaching tool" , uno strumento educativo volto ad insegnare un metodo di mappatura delle frane utilizzando immagini satellitari stereoscopiche ad alta risoluzione.
Olga Petrucci, Paola Salvati, Luigi Aceto, Cinzia Bianchi, Angela Aurora Pasqua,
Mauro Rossi and Fausto Guzzetti, 2018, The Vulnerability of People to Damaging Hydrogeological Events in the Calabria Region (Southern Italy).,
International journal of environmental research and public health (Online) 15 (2018). doi_10.3390/ijerph15010048,
DOI: 10.3390%2Fijerph15010048
Abstract
Abstract: Background_ Damaging Hydrogeological Events (DHEs) are severe weather periods during
which floods, landslides, lightning, windstorms, ...
Abstract: Background_ Damaging Hydrogeological Events (DHEs) are severe weather periods during
which floods, landslides, lightning, windstorms, hail or storm surges can harm people. Climate
change is expected to increase the frequency/intensity of DHEs and, consequently, the potential harm
to people. Method_ We investigated the impacts of DHEs on people in Calabria (Italy) over 37 years
(1980-2016). Data on 7288 people physically affected by DHEs were gathered from the systematic
analysis of regional newspapers and collected in the database named PEOPLE. The damage was
codified in three severity levels as follows_ fatalities (people who were killed), injured (people who
suffered physical harm) and involved (people who were present at the place where an accident
occurred but survived and were not harmed). During the study period, we recorded 68 fatalities,
566 injured and 6654 people involved in the events. Results_ Males were more frequently killed,
injured and involved than females, and females who suffered fatalities were older than males
who suffered fatalities, perhaps indicating that younger females tended to be more cautious than
same-aged males, while older females showed an intrinsic greater vulnerability. Involved people were
younger than injured people and fatalities, suggesting that younger people show greater promptness
in reacting to dangerous situations. Floods caused the majority of the fatalities, injured and involved
people, followed by landslides. Lightning was the most dangerous phenomenon, and it affected a
relatively low number of people, killing 11.63% of them and causing injuries to 37.2%. Fatalities and
injuries mainly occurred outdoors, largely along roads. In contrast, people indoors, essentially in
public or private buildings, were more frequently involved without suffering harm. Being "dragged
by water/mud" and "surrounded by water/mud", respectively, represented the two extremes of
dynamic dangerousness. The dragging effect of rapid-flowing water totally or partially obstructed
the attempts of people to save their lives. In contrast, people surrounded by steady water/mud
encountered difficulties but ultimately could survive. Conclusions_ The study outcomes can be used
in informational campaigns to increase risk awareness among both administrators and citizens and
to improve community resilience, particularly in promoting self-protective behaviors and avoiding
the underestimation of hazardous situations.
M. Rogora, L. Frate, M.L. Carranza, M. Freppaz, A. Stanisci, I. Bertani, R. Bottarin, A. Brambilla, R. Canullo, M. Carbognani, C. Cerrato, S. Chelli, E. Cremonese, M. Cutini, M. Di Musciano, B. Erschbamer, D. Godone, M. Iocchi, M. Isabellon, A. Magnani, L. Mazzola, U. Morra di Cella, H. Pauli, M. Petey, B. Petriccione , F. Porro, R. Psenner, G. Rossetti, A. Scotti, R. Sommaruga, U. Tappeiner, J.-P. Theurillat, M. Tomaselli, D. Viglietti, R. Viterbi, P. Vittoz, M. Winkler, G. Matteucci, 2018, Assessment of climate change effects on mountain ecosystems through a cross-site analysis in the Alps and Apennines,
Science of the total environment 624 (2018): 1429–1442. doi_10.1016/j.scitotenv.2017.12.155,
DOI: 10.1016%2Fj.scitotenv.2017.12.155
Abstract
Mountain ecosystems are sensitive and reliable indicators of climate change. Long-term studies may be extremely ...
Mountain ecosystems are sensitive and reliable indicators of climate change. Long-term studies may be extremely useful in assessing the responses of high-elevation ecosystems to climate change and other anthropogenic drivers from a broad ecological perspective. Mountain research sites within the LTER (Long-Term Ecological Research) network are representative of various types of ecosystems and span a wide bioclimatic and elevational range.
Here, we present a synthesis and a review of the main results from ecological studies in mountain ecosystems at 20 LTER sites in Italy, Switzerland and Austria covering in most cases more than two decades of observations. We analyzed a set of key climate parameters, such as temperature and snow cover duration, in relation to vascular plant species composition, plant traits, abundance patterns, pedoclimate, nutrient dynamics in soils and water, phenology and composition of freshwater biota.
The overall results highlight the rapid response of mountain ecosystems to climate change, with site-specific characteristics and rates. As temperatures increased, vegetation cover in alpine and subalpine summits increased as well. Years with limited snow cover duration caused an increase in soil temperature and microbial biomass during the growing season. Effects on freshwater ecosystems were also observed, in terms of increases in solutes, decreases in nitrates and changes in plankton phenology and benthos communities. This work highlights the importance of comparing and integrating long-term ecological data collected in different ecosystems for a more comprehensive overview of the ecological effects of climate change. Nevertheless, there is a need for (i) adopting co-located monitoring site networks to improve our ability to obtain sound results from cross-site analysis, (ii) carrying out further studies, in particular short-term analyses with fine spatial and temporal resolutions to improve our understanding of responses to extreme events, and (iii) increasing comparability and standardizing protocols across networks to distinguish local patterns from global patterns.
Michele Santangelo, Ivan Marchesini, Francesco Mirabella, Francesco Bucci, Mauro Cardinali, Fausto Guzzetti, 2018, From photo-geology to 3D geological models. An open source approach,
4th Open Source Geospatial Research & Education Symposium (OGRS2016), pp. 105–113, Perugia, 12-14/10/2016,
Abstract
Three-dimensional modeling of geological bodies is a useful tool for multiple
applications. Such tasks are usually ...
Three-dimensional modeling of geological bodies is a useful tool for multiple
applications. Such tasks are usually accomplished starting from fieldcollected data, which typically suffer from intrinsic limitations such as
accessibility constraints and punctuality of data collected. In this work, we
explore the reliability of photo-geological mapping from interpretation of
aerial photographs in providing data useful to build up 3D geological models.
The test was conducted in a 15 km2
in Umbria, central Italy. The three-steps
open source GIS procedure that outputs 3D models from photo-geological
data was developed using python in GRASS GIS environment and GNU-Linux
OS. We maintain that this procedure can have potential broad applications in
Earth Sciences, including geological and structural analyses, up to the
preliminary evaluation of potential reservoirs.
Martina Wilde1, Andreas Günther1, Paola Reichenbach2, Jean-Philippe Malet3, Javier Hervás4, 2018, Pan-European Landslide Susceptibility Mapping_ ELSUS Version 2,
Journal of maps (Stud. ed.) 14 (2018). doi_10.1080/17445647.2018.1432511,
DOI: 10.1080%2F17445647.2018.1432511
Abstract
We present an updated version of the European landslide susceptibility map ELSUS 1000 that was ...
We present an updated version of the European landslide susceptibility map ELSUS 1000 that was released through the European Soil Data Centre in 2013. The ELSUS V2 map shows the landslide susceptibility zonation for individual climate-physiographic zones across Europe. ELSUS V2 covers a larger area of Europe than ELSUS 1000 as it includes Iceland, Cyprus, the Faroes, and the Shetlands, at a higher spatial resolution (200 x 200 m). The updated map was prepared using the same semi-quantitative method as for ELSUS 1000, combining landslide frequency ratios information with a spatial multi-criteria evaluation model of three thematic predictors_ slope angle, shallow subsurface lithology and land cover. However, the new map was prepared using also_ i) an extended landslide inventory, containing 30% of additional locations for model calibration, map validation and classification, and ii) a new lithological data set, based on harmonized shallow subsurface information derived from the International Hydrogeological Map of Europe (IHME). The new version of the map increases the overall predictive performance of ELSUS by 8%.
Paola Reichenbach (1), Mauro Rossi (1), Bruce Malamud (2), Monika Mihir (2,3), and Fausto Guzzetti (1), 2018, A review of statistically-based landslide susceptibility models,
Earth-science reviews (2018). doi_10.1016/j.earscirev.2018.03.001,
DOI: 10.1016%2Fj.earscirev.2018.03.001
Abstract
In this paper, we do a critical review of statistical methods for landslide susceptibility assessment ...
In this paper, we do a critical review of statistical methods for landslide susceptibility assessment and associated terrain zonations. Landslide susceptibility is the likelihood of a landslide occurring in an area depending on local terrain conditions, estimating "where" landslides are likely to occur. Since the first attempts to assess landslide susceptibility in the mid-1970s, hundreds of papers have been published using a variety of approaches and methods in different geological and climatic settings. Here, we critically review the statistically-based landslide susceptibility assessment literature by systematically searching for and then compiling an extensive database of 565 peer-review articles from 1983 to 2016. For each article in the literature database, we noted 31 categories/sub-categories of information including study region/extent, landslide type/number, inventory type and period covered, statistical model used, including variable types, model fit/prediction performance evaluation method, and strategy used to assess the model uncertainty. We present graphical visualisations and discussions of commonalities and differences found as a function of region and time, revealing a significant heterogeneity of thematic data types and scales, modelling approaches, and model evaluation criteria. We found that the range of thematic data types used for susceptibility assessment has not changed significantly with time, and that for a number of studies the geomorphological significance of the thematic data used is poorly justified. We also found that the most common statistical methods for landslide susceptibility assessment include logistic regression, neural network analysis, data-overlay, index-based and weight of evidence analyses, with an increasing preference towards machine learning methods in the recent years. Although an increasing number of studies in recent years have assessed the model performance, in terms of model fit and prediction performance, only a handful of studies have evaluated the model uncertainty. Adopting a Susceptibility Quality Level index, we found that the quality of published models has improved over the years, but top-quality assessments remain rare. We identified a clear geographical bias in susceptibility study locations, with many studies in China, India, Italy, South Korea and Turkey, and only a few in Africa, South America and Oceania. Based on previous literature reviews, the analysis of the information collected in the literature database, and our own experience on the subject, we provide recommendations for the preparation, evaluation, and use of landslide susceptibility models and associated terrain zonations.
Crema S., Cavalli M., 2018, SedInConnect: a stand-alone, free and open source tool for the assessment of sediment connectivity,
Computers & geosciences (2018): 39–45. doi_10.1016/j.cageo.2017.10.009,
DOI: 10.1016%2Fj.cageo.2017.10.009
Abstract
There is a growing call, within the scientific community, for solid theoretic frameworks and usable ...
There is a growing call, within the scientific community, for solid theoretic frameworks and usable indices/models to assess sediment connectivity. Connectivity plays a significant role in characterizing structural properties of the landscape and, when considered in combination with forcing processes (e.g., rainfall-runoff modelling), can represent a valuable analysis for an improved landscape management. In this work, the authors present the development and application of SedInConnect_ a free, open source and stand-alone application for the computation of the Index of Connectivity (IC), as expressed in Cavalli et al. (2013) with the addition of specific innovative features. The tool is intended to have a wide variety of users, both from the scientific community and from the authorities involved in the environmental planning. Thanks to its open source nature, the tool can be adapted and/or integrated according to the users' requirements. Furthermore, presenting an easy-to-use interface and being a stand-alone application, the tool can help management experts in the quantitative assessment of sediment connectivity in the context of hazard and risk assessment. An application to a sample dataset and an overview on up-to-date applications of the approach and of the tool shows the development potential of such analyses. The modelled connectivity, in fact, appears suitable not only to characterize sediment dynamics at the catchment scale but also to integrate prediction models and as a tool for helping geomorphological interpretation.
R. Schlögel(1,2), I. Marchesini (3), M. Alvioli (3), P. Reichenbach (3), M. Rossi (3), J.-P. Malet (2), 2018, Optimizing landslide susceptibility zonation_ Effects of DEM spatial resolution and slope unit delineation on logistic regression models,
Geomorphology (Amst.) 301 (2018): 10–20. doi_10.1016/j.geomorph.2017.10.018,
DOI: 10.1016%2Fj.geomorph.2017.10.018
Abstract
We perform landslide susceptibility zonation with slope units using three digital elevation models (DEMs) of ...
We perform landslide susceptibility zonation with slope units using three digital elevation models (DEMs) of varying spatial resolution of the Ubaye Valley (South French Alps). In so doing, we applied a recently developed algorithm automating slope unit delineation, given a number of parameters, in order to optimize simultaneously the partitioning of the terrain and the performance of a logistic regression susceptibility model. The method allowed us to obtain optimal slope units for each available DEM spatial resolution. For each resolution, we studied the susceptibility model performance by analyzing in detail the relevance of the conditioning variables. The analysis is based on landslide morphology data, considering either the whole landslide or only the source area outline as inputs. The procedure allowed us to select the most useful information, in terms of DEM spatial resolution, thematic variables and landslide inventory, in order to obtain the most reliable slope unit-based landslide susceptibility assessment.
Rainato, Riccardo; Picco, Lorenzo; Cavalli, Marco; Mao, Luca; Neverman, Andrew J.; Tarolli, Paolo, 2018, Coupling Climate Conditions, Sediment Sources and Sediment Transport in an Alpine Basin,
Land degradation & development (Print) 29 (2018): 1154–1166. doi_10.1002/ldr.2813,
DOI: 10.1002%2Fldr.2813
Abstract
In a fluvial system, mountain basins control sediment export to the lowland rivers. Hence, analysis ...
In a fluvial system, mountain basins control sediment export to the lowland rivers. Hence, analysis of erosion processes and sediment delivery patterns in mountain basins is a key factor for many applications such as land-use management, hazard assessment and infrastructure design. Several studies have investigated the alterations triggered by recent climatic change on the hydrological regime, while only a few works have explored the consequences on fluvial sediment dynamics. Here, we combined and analyzed the quasi-unique dataset of climatic conditions, landform response and sediment export produced, since 1986 in the Rio Cordon basin (5 km2, Eastern Italian Alps) to examine the sediment delivery processes occurring in the last 3 decades. The temperature, precipitation and fluvial sediment fluxes in the basin were analyzed using continuous measurement executed by a permanent monitoring station, while the evolution of sediment source areas was investigated using three sediment source inventories. The results showed that during the period 1986-1993 the sediment fluxes (339 Mg yr-1) reflected the stable trend of the climatic conditions. The period between the first and second source inventory (i.e. 1994-2006) was characterized by climatic fluctuations and by the occurrence of high magnitude floods. Nevertheless, a limited increase in the extent of sediment source areas was detected, suggesting that the increased sediment export (759 Mg yr-1) was mainly driven by in-channel sediment supply. Notwithstanding the marked climate warming and the increased precipitation, a weak source area evolution and a reduction in sediment export (237 Mg yr-1) were observed during the period 2007-2015. In particular, the higher rainfall did not result in an intensification of flood events, stressing the absence of hillslope-channel connectivity.
M. Alvioli(1), L. Frankfurt(2,3), D.V. Perepelitsa(4), and M. Strikman(3), 2018, Global analysis of color fluctuation effects in proton- and deuteron-nucleus collisions at RHIC and the LHC,
Physical review. D, Particles, fields, gravitation, and cosmology 98 (2018): 071502-1–071502-6. doi_10.1103/PhysRevD.98.071502,
DOI: 10.1103%2FPhysRevD.98.071502
Abstract
We test the hypothesis that configurations of a proton with a large-x parton, xp?0.1, have ...
We test the hypothesis that configurations of a proton with a large-x parton, xp?0.1, have a smaller than average transverse size. The application of the QCD Q2 evolution equations shows that these small configurations also have a significantly smaller interaction strength, which has observable consequences in proton -- nucleus collisions. We perform a global analysis of jet production data in proton-- and deuteron--nucleus collisions at RHIC and the LHC. Using a model which takes a distribution of interaction strengths into account, we quantitatively extract the xp-dependence of the average interaction strength, ?(xp), over a wide kinematic range. By comparing the RHIC and LHC results, our analysis finds that the interaction strength for small configurations, while suppressed, grows faster with collision energy than does that for average configurations. We check that this energy dependence is consistent with the results of a method which, given ?(xp) at one energy, can be used to quantitatively predict that at another. This finding further suggests that at even lower energies, nucleons with a large-xp parton should interact much more weakly than those in an average configuration, a phenomenon in line with explanations of the EMC effect for large-xp quarks in nuclei based on color screening.
Persichillo M.G.; Bordoni M.; Cavalli M.; Crema S.; Meisina C., 2018, The role of human activities on sediment connectivity of shallow landslides,
Catena (Cremling.) 160 (2018): 261–274. doi_10.1016/j.catena.2017.09.025,
DOI: 10.1016%2Fj.catena.2017.09.025
Abstract
Sediment connectivity within a catchment depends largely on the morphological complexity of the catchment and ...
Sediment connectivity within a catchment depends largely on the morphological complexity of the catchment and is strictly related to the anthropogenic modification of the landscape.
In this context, the present research evaluates the role of anthropogenic effects on landscape modifications and the resulting influence on sediment delivery. An assessment of sediment connectivity was carried out for three different human impact scenarios_ (i) drainage system density reduction, (ii) road network variation and (iii) land use changes. In addition, shallow landslides were used as sediment source areas to evaluate the potential connection between these sediment sources and downstream areas (e.g. main channels and road network).
Two small catchments in the Oltrepò Pavese area (Northern Apennines, Italy), with different size and morphological setting, were analysed_ the Rio Frate (1.9 km2) and the Versa (38 km2) catchments. In both areas, several shallow landslides were triggered in 2009 (Rio Frate and Versa) and in 2013 (Versa).
Results highlight the role of the landscape complexity in coupling/decoupling upstream sediment sources, such as shallow landslides, from the main channel network and roads.
In addition, the analysis identified instability phenomena characterized by high connectivity values, allowing determination of the areas in which mobilized sediment could potentially damage important infrastructures such as the road network or contribute to flooding induced by aggradation or obstruction of the river bed.
Zhou, G.G.D., Song, D., Choi, C.E., Pasuto, A., Sun, Q.C., Dai, 2018, Surge impact behavior of granular flows_ effects of water content,
Landslides (Berl., Internet) 15 (2018): 695–709. doi_10.1007/s10346-017-0908-6,
DOI: 10.1007%2Fs10346-017-0908-6
Abstract
Understanding the fundamental dynamics of interaction between multi-phase geophysical flows and engineering structures is crucial ...
Understanding the fundamental dynamics of interaction between multi-phase geophysical flows and engineering structures is crucial for mitigating geophysical hazards. Specifically, liquid phase between particles induces matric suction which could play a significant part in regulating flow dynamics and warrants further consideration. In this study, flume model tests were conducted to investigate the effects of water content (0-30%) on the impact behavior of granular flows. The particle image velocimetry technique was adopted to visualize the impact kinematics and the impact force was measured through a model barrier system. Results revealed that, besides geometric effects (kinetic sieving), mechanical effects (shearing and collision) are also vital for the mechanism of reverse segregation. At higher water contents, 20 and 30% in this study, discrete-surge impact, rather than a progressive impact process, was observed. The discrete surges induce impulses on the barrier. The discrete surges result from selforganization of unsaturated granular flows to overcome the enhanced shear strength induced by matric suction. Finally, a dimensionless index, namely the suction number, is used to quantify the effect of suction on the dynamic behavior of granular flows.
Even for large-scale geophysical flows, if the content of fine particles is high, effect of suction should not be neglected.
Tran The Viet(1,3), Massimiliano Alvioli(2), Giha Lee(3), Hyun Uk An(4), 2018, Three-dimensional, time-dependent modeling of rainfall-induced landslides over a digital landscape_ a case study,
Landslides (Berl., Print) 15 (2018): 1071–1084. doi_10.1007/s10346-017-0931-7,
DOI: 10.1007%2Fs10346-017-0931-7
Abstract
Physically based approaches for the regional assessment of slope stability using DEM topography usually consist ...
Physically based approaches for the regional assessment of slope stability using DEM topography usually consist of one-dimensional descriptions and include many simplifying assumptions with respect to more realistic, three-dimensional analyses. We investigated a new application of the well-known, publicly available software TRIGRS (Transient Rainfall Infiltration and Grid-Based Regional Slope-Stability Analysis) in combination with Scoops3D, to analyze three-dimensional slope stability throughout a digital landscape in a time-dependent fashion, typically non implemented in three-dimensional models. TRIGRS was used to simulate the dynamic hydraulic conditions within the slopes induced by a rainstorm. Scoops3D then used the resulting pore water pressure for three-dimensional stability assessment. We applied this approach to the July 2011 landslide event in Mt. Umyeon, South Korea, and results were compared with the landslide initiation locations reported for this rainfall event. Soil depth in the study area was described by three different simple models. Stability maps, obtained by the one-dimensional (TRIGRS only) and three-dimensional (TRIGRS and Scoops3D), time-dependent approaches, were compared to observations to assess the timing and locations of unstable sites by means of a synthetic index, previously specifically developed for dealing with point landslide locations. We highlight the performance of the three-dimensional approach with respect to the one-dimensional method represented by TRIGRS alone, and the consistency of the time-dependence of the results obtained using the combined approach with observations.
De Finis E.; Gattinoni P.; Marchi L.; Scesi L., 2018, Anomalous Alpine fans_ from the genesis to the present hazard,
Landslides (Berl., Print) (2018): 683–694. doi_10.1007/s10346-017-0894-8,
DOI: 10.1007%2Fs10346-017-0894-8
Abstract
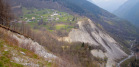
The present paper aims at characterising Alpine anomalous basin-fan systems, in order to develop a ...
The present paper aims at characterising Alpine anomalous basin-fan systems, in order to develop a method for hazard assessment for such fans. The review of previous studies revealed that anomalous basin-fan systems are often associated with deep-seated slope failure and present-day hazard is associated to debris flow occurrence. Taking into account these peculiarities, a modelling approach to assess the present day hazard in anomalous fans has been developed and applied to the Sernio fan (Valtellina, northern Italy). Debris flow inundation areas have been simulated by means of a numerical model (RApid Mass MovementS (RAMMS) debris flow), which includes a routine for the sediment entrainment. The range of the model parameters was defined based on previous studies, enabling a sensitivity analysis on the debris flow runout, as well as the flow height and velocity. Numerical results point out the paramount importance of entrainment phenomena on debris flow dynamic in anomalous systems, especially with reference to the bulking factor and debris yield rate that reach very high values, typical of basins with unlimited solid supply.
Mazzorana B.; Ruiz-Villanueva V.; Marchi L.; Cavalli M.; Gems B.; Gschnitzer T.; Mao L.; Iroume A.; Valdebenito G., 2018, Assessing and mitigating large wood-related hazards in mountain streams_ Recent approaches,
Journal of flood risk management (2018): 207–222. doi_10.1111/jfr3.12316,
DOI: 10.1111%2Fjfr3.12316
Abstract
The assessment and mitigation of floods in mountain streams, when large wood (LW) is transported, ...
The assessment and mitigation of floods in mountain streams, when large wood (LW) is transported, pose several challenges. The process chain consisting of flood propagation, LW recruitment, entrainment, transport, and entrapment triggers, at critical sections such as bridges, unexpected and exacerbated impacts to the exposed built environment. We provide a review on the recent advances in modelling LW dynamics during extreme river floods through computational approaches. Moreover, we describe how scaled flume experiments can enhance process understanding at critical flow sections such as bridges to address risk mitigation problems. Additionally, we present a framework based on Formative Scenario Analysis (FSA) to allow for expert knowledge integration and to subsequently derive consistent hazard process scenarios in steep mountain streams where the application of computational approaches is less reliable. Finally, we discuss how the application of the presented set of assessment methods can support integral flood risk management by explicitly considering LW dynamics since the effectiveness of mitigation critically depends on the acquired process understanding.
Federica Lucà , Gabriele Buttafuoco, Oreste Terranova, 2018, 2.03 – GIS and Soil,
Comprehensive Geographic Information Systems, edited by Bo Huang, pp. 37–50. Oxford_ Elsevier Ltd, 2018,
Abstract
Soil is a natural body consisting of layers (soil horizons) resulting from the interplay between ...
Soil is a natural body consisting of layers (soil horizons) resulting from the interplay between climate, topography, organisms, parent material (underlying geologic bedrock), and time. Accurate soil data are needed in order to develop reliable and high-resolution soil maps for hydrological analysis, environmental protection, agriculture, and forest management. The several items of information required for soil characterization, deriving from sources with different spatial resolution, can be easily stored and managed within a geographic information system (GIS). Digital soil mapping (DSM) allows one to analyze the relationships between soil properties and ancillary data (e.g., topographic attributes and remote/proximal sensing data) through several pedometric techniques. The article represents an attempt to synthesize the use of GIS in soil sciences at different spatial scale by (i) describing the increasing availability of ancillary data for soil characterization; (ii) illustrating the main relationships between soil properties and digital elevation model-derived topographic features; (iii) summarizing spatial and nonspatial pedometric techniques for analyzing and modeling soil properties; (iv) illustrating some applications of GIS in soil science also highlighting the contribution of DSM for land use planning and soil protection.
Coviello, Velio; Arattano, Massimo; Marchi, Lorenzo; Comiti, Francesco; Macconi, Pierpaolo, 2018, Research on debris flow early warning in the Gadria catchment (Eastern Italian Alps),
20th EGU General Assembly, EGU2018, Proceedings from the conference held 4-13 April, 2018 in Vienna, Austria, p.16305, pp. 16305–16305, Wien, 4-13/04/2018,
Abstract
Early Warning Systems (EWSs) for debris flows are receiving an increasing attention in the scientific ...
Early Warning Systems (EWSs) for debris flows are receiving an increasing attention in the scientific community. In particular, the so-called event-EWSs or alarm systems are becoming more attractive due the continuous development of new, compact and low-cost distributed sensor networks. Their goal is to detect the occurrence of a flow event when the process is already in progress, in order to spread an alarm and to evacuate those vulnerable infrastructures that would not require long alert time, typically transportation routes. Their performances depends on their capability (i) to perform accurate and rapid measurements, (ii) to store and process in real time a continuous data-stream, and (iii) to automatically disseminate the alarm information. EWSs can be definitively more cost-effective than structural mitigation measures but their design, management and maintenance are complex tasks that also need a direct involvement of local authorities. In addition, numerous EWSs are operational worldwide but few of them are regularly followed up by researchers after their installation. In this work we present the performance of an EWS specifically designed for both research and operational purposes, under testing in the Gadria basin (Eastern Italian Alps) since 2013. The employed warning algorithm is based on the Signal-To-Noise (SNR) ratio detected by a linear array of three geophones installed along the main channel and located right upstream to an artificial retention basin. Complementary data (rainfalls, flow stage measurements, videos) assure event characterization and alarm validation. A flashing light installed on the bank of the channel is activated by the EWS in case of event detection, providing a visual validation of the algorithm performances. During five monitored seasons, eight debris flows and several debris floods were documented. All debris flow events that occurred from 2013 to 2016 were successfully detected by the EWS (five true positives, zero false negatives) and four short-duration false positives were produced. False alarms were discarded introducing a directional criterion for the threshold triggering (SNR threshold exceeded progressively with time from upstream to downstream). During the last monitoring season, instrumental bias partially compromised data recordings, storage and the warning outcome. This highlights again the importance of follow-up and maintenance of EWSs.
G. Iovine 1, I. Guagliardi 2, C. Bruno 1, R. Greco 1, A. Tallarico 3, G. Falcone 3, F. Lucà 2, G. Buttafuoco 2, 2018, Soil-gas radon anomalies in three study areas of central-northern Calabria (southern Italy),
Natural hazards (Dordr., Online) 91 (2018): 193–219. doi_10.1007/s11069-017-2839-x,
DOI: 10.1007%2Fs11069-017-2839-x
Abstract
Soil-gas radon concentrations and exhalation rates have generally been observed to be anomalously high along ...
Soil-gas radon concentrations and exhalation rates have generally been observed to be anomalously high along active faults in many parts of the world. The soil-gas method is based on the principle that faults and fractures in rocks are highly-permeable pathways along which gases can migrate upward from deep crust and mantle to soil cover, retaining their source signatures. The present study summarizes the influence of fault zones on anomalous radon concentrations in soil by integrated geophysical and geo-structural analyses in three study areas of Central-Northern Calabria (Southern Italy). Soil-gas radon surveys have been carried out by means of an alpha scintillation counting system, at 12,509 locations between 2002 and 2004. A geostatistical approach has been used to estimate the spatial distribution of soil radon concentrations. Relations among soil-gas distribution and geo-structural features have been evaluated by ordinary multi-Gaussian kriging.
Highest soil radon concentrations (ca. 90 kBq m-3) have been measured in the Rossanese sector. In the three study areas, no appreciable differences can be noticed among lithotypes, with the highest concentration values (ca. 89 kBq m-3) measured in alluvial deposit and in clay. Measurements of soil-gas radon reveal anomalies clearly connected to the tectonic structures. Increased signals are linearly distributed along regional WNW-ESE trending shear zones, with main pathways of concentration also recognizable along the E-W fault system in the Rossanese sector, the N-S fault system in the Crati Graben and the Catanzaro Trough, and the NE-SW fault system in the Catanzaro Trough. The distribution of epicentres of historical earthquakes occurred between 1184 and 2001 confirms the recent activity of the same fault systems. Soil-gas radon concentrations generally increase, as expected, with decreasing distance to the faults.
Jalilvand E.; Tajrishy M.; Brocca L.; Massari C.; Ghazi Zadeh Hashemi S.; Ciabatta L., 2018, Estimating the drainage rate from surface soil moisture drydowns_ Application of DfD model to in situ soil moisture data,
Journal of hydrology (Amst.) 565 (2018): 489–501. doi_10.1016/j.jhydrol.2018.08.035,
DOI: 10.1016%2Fj.jhydrol.2018.08.035
Abstract
The large heterogeneity in soil surface conditions makes it impracticable to obtain reliable estimates of ...
The large heterogeneity in soil surface conditions makes it impracticable to obtain reliable estimates of soil hydraulic parameters for areas larger than few squared kilometers. However, identifying these parameters on a global scale is essential for many hydrological and climatic applications. In this study, a new approach named Drainage from Drydown (DfD) is proposed to estimate the coefficients of drainage using soil moisture observations. DfD firstly selects multiple drydown events when surface runoff and evapotranspiration rates are negligible compared to the drainage rate. Secondly, by inverting the soil water balance equation, the drainage coefficients are obtained. Synthetic experiments are carried out in order to tune the overall procedure. DfD is then tested with in situ observations at 8 different sites worldwide characterized by different climates and soil types. The reliability of the DfD is evaluated by using the DfD drainage coefficients in a physically based soil water balance model (SWB) for simulating soil moisture and a rainfall estimation model (SM2RAIN). The results indicate that the climate and the soil conditions exert an important role in the occurrence and magnitude of drainage rate. DfD is found capable of correctly identify periods in which drainage rate is the dominant process. Drainage coefficients obtained from DfD are consistent with the expected soil hydraulic properties based on the soil texture and land cover at each site. By using DfD drainage coefficients to estimate rainfall and soil moisture via SM2RAIN and SWB, promising results are obtained with median correlation of 0.83 and 0.91 between estimated and in situ data. However, in sites characterized by high rate of evapotranspiration (>700 mm/year) and low permeable soil (e.g., clay) the DfD performance is reduced. Overall, DfD demonstrates the ability to decouple drainage and evapotranspiration processes and to estimate the drainage coefficients from in situ observations.
Bauer-Marschallinger, Bernhard; Paulik, Christoph; Hochstoeger, Simon; Mistelbauer, Thomas; Modanesi, Sara; Ciabatta, Luca; Massari, Christian; Brocca, Luca; Wagner, Wolfgang, 2018, Soil Moisture from Fusion of Scatterometer and SAR_ Closing the Scale Gap with Temporal Filtering,
Remote sensing (Basel) 10 (2018). doi_10.3390/rs10071030,
DOI: 10.3390%2Frs10071030
Abstract
Soil moisture is a key environmental variable, important to e.g., farmers, meteorologists, and disaster management ...
Soil moisture is a key environmental variable, important to e.g., farmers, meteorologists, and disaster management units. We fuse surface soil moisture (SSM) estimates from spatio-temporally complementary radar sensors through temporal filtering of their joint signal and obtain a kilometre-scale, daily soil water content product named SCATSAR-SWI. With 25 km Metop ASCAT SSM and 1 km Sentinel-1 SSM serving as input, the SCATSAR-SWI is globally applicable and achieves daily full coverage over operated areas. We employ a near-real-time-capable SCATSAR-SWI algorithm on a fused 3 year ASCAT-Sentinel-1-SSM data cube over Italy, obtaining a consistent set of model parameters, unperturbed by coverage discontinuities. An evaluation of a therefrom generated SCATSAR-SWI dataset, involving a 1 km Soil Water Balance Model (SWBM) over Umbria, yields comprehensively high agreement with the reference data (median R = 0.61 vs. in situ; 0.71 vs. model; 0.83 vs. ASCAT SSM). While the Sentinel-1 signal is attenuated to some extent, the ASCAT's signal dynamics are fully transferred to the SCATSAR-SWI and benefit from the Sentinel-1 parametrisation. Using the SM2RAIN approach, the SCATSAR-SWI shows excellent capability to reproduce 5 day-accumulated rainfall over Italy, with R = 0.89 against observed rainfall. The SCATSAR-SWI is currently in preparation towards operational product dissemination in the Copernicus Global Land Service (CGLS).
Samuele Segoni (1), Luca Piciullo (2), Stefano Luigi Gariano (3), 2018, A review of the recent literature on rainfall thresholds for landslide occurrence,
Landslides (Berl., Internet) 15 (2018): 1483–1501. doi_10.1007/s10346-018-0966-4,
DOI: 10.1007%2Fs10346-018-0966-4
Abstract
The topic of rainfall thresholds for landslide occurrence was thoroughly investigated, producing abundance of case ...
The topic of rainfall thresholds for landslide occurrence was thoroughly investigated, producing abundance of case studies at different scales of analysis and several technical and scientific advances. We reviewed the most recent papers published in scientific journals, highlighting significant advances and critical issues. We collected and grouped all the information on rainfall thresholds into four categories_ publication details, geographical distribution and uses, dataset features, thresholds definition. In each category, we selected descriptive information to characterize each one of the 115 rainfall threshold published in the last 9 years.
The main improvements that stood out from the review are the definition of standard procedures for the identification of rainfall events and for the objective definition of the thresholds. Numerous advances were achieved in the cataloguing of landslides too, which can be defined as one of the most important variables, together with rainfall data, for drawing reliable thresholds. Another focal point of the reviewed articles was the increased definition of thresholds with different exceedance probabilities to be employed for the definition of warning levels in landslide early warning systems. Nevertheless, drawbacks and criticisms can be identified in most part of the recent literature on rainfall thresholds. The main issues concern the validation process, which is seldom carried out, and the very frequent lack of explanations for the rain gauge selection procedure.
The paper may be used as a guide to find adequate literature on the most used or the most advanced approaches followed in every step of the procedure for defining reliable rainfall thresholds. Therefore, it constitutes a guideline for future studies and applications, in particular in early warning systems. The paper also aims at addressing the gaps that need to be filled to further enhance the quality of the research products in this field. The contribution of this manuscript could be seen not only as a review of the state of the art, but also an effective method to disseminate the best practices among scientists and stakeholders involved in landslide hazard management.
Arattano, Massimo; Peppoloni, Silvia; Gatti, Albertina, 2018, The ethical duty to divulge geosciences and the improvement of communication skills to fulfil it,
Episodes 41 (2018): 96–102. doi_10.18814/epiiugs/2018/018007,
DOI: 10.18814%2Fepiiugs%2F2018%2F018007
Abstract
In recent years the commitment to disseminate the geological knowledge, making it available for citizens ...
In recent years the commitment to disseminate the geological knowledge, making it available for citizens and decisionmakers, has been recognized as a precise ethical duty of the geologist. However the fulfilment of the duty to disseminate the geoscience knowledge requires good communication skills that should be adequately trained, since often the university studies don't include such training. A specific research has been carried out to explore the possibility to develop a short training course capable of improving the expressive and communication abilities of professionals. A set of exercises has been also expressly developed to improve the metacognitive skills of the participants (metacognition is the knowledge and regulation of one's cognitive activities in learning processes). The course has been delivered to professionals belonging to the Professional Association of Engineers (FOIT) in Turin, Italy, and has been able to significantly improve their expressive and communication abilities, increasing their interest and willingness to divulge their knowledge, recovering their confidence to succeed in this task and helping them to become more effective communicators. The contents of the course are now available, upon request, for anyone interested in teaching it elsewhere and/or improving its contents. Providing both professional and research geologists with means to renew their interest and ability to communicate can be a useful contribution to raise their (geo)ethical conscience and to help them to more easily carry out their ethical commitment.
Camici, S.; Ciabatta, L.; Massari, C.; Brocca, L., 2018, How reliable are satellite precipitation estimates for driving hydrological models_ A verification study over the Mediterranean area,
Journal of hydrology (Amst.) 563 (2018): 950–961. doi_10.1016/j.jhydrol.2018.06.067,
DOI: 10.1016%2Fj.jhydrol.2018.06.067
Abstract
Satellite-based rainfall products (SRPs) are nowadays available at ever increasing accuracy and higher spatial and ...
Satellite-based rainfall products (SRPs) are nowadays available at ever increasing accuracy and higher spatial and temporal resolution with respect to the past. Despite this, they are scarcely used in hydrological modeling. The main reasons may be related to_ 1) the large bias characterizing satellite precipitation estimates, which is dependent on rainfall intensity and the season, 2) the relatively large spatial/temporal resolution with respect to the applications, 3) the timeliness, which is often insufficient for operational purposes, and 4) a general (often not justified) skepticism of the hydrological community in the use of satellite products for land applications.
Thaler, Sabina; Brocca, Luca; Ciabatta, Luca; Eitzinger, Josef; Hahn, Sebastian; Wagner, Wolfgang, 2018, Effects of Different Spatial Precipitation Input Data on Crop Model Outputs under a Central European Climate,
Atmosphere (Basel) 9 (2018). doi_10.3390/atmos9080290,
DOI: 10.3390%2Fatmos9080290
Abstract
Crop simulation models, which are mainly being utilized as tools to assess the consequences of ...
Crop simulation models, which are mainly being utilized as tools to assess the consequences of a changing climate and different management strategies on crop production at the field scale, are increasingly being used in a distributed model at the regional scale. Spatial data analysis and modelling in combination with geographic information systems (GIS) integrates information from soil, climate, and topography data into a larger area, providing a basis for spatial and temporal analysis. In the current study, the crop growth model Decision Support System for Agrotechnology Transfer (DSSAT) was used to evaluate five gridded precipitation input data at three locations in Austria. The precipitation data sets consist of the INtegrated Calibration and Application Tool (INCA) from the Meteorological Service Austria, two satellite precipitation data sourcesMultisatellite Precipitation Analysis (TMPA) and Climate Prediction Center MORPHing (CMORPH)and two rainfall estimates based on satellite soil moisture data. The latter were obtained through the application of the SM2RAIN algorithm (SM2R(ASC)) and a regression analysis (RA(ASC)) applied to the Metop-A/B Advanced SCATtermonter (ASCAT) soil moisture product during a 9-year period from 2007-2015. For the evaluation, the effect on winter wheat and spring barley yield, caused by different precipitation inputs, at a spatial resolution of around 25 km was used. The highest variance was obtained for the driest area with light-textured soils; TMPA and two soil moisture-based products show very good results in the more humid areas. The poorest performances at all three locations and for both crops were found with the CMORPH input data.
Hdeib, Rouya; Abdallah, Chadi; Colin, Francois; Brocca, Luca; Moussa, Roger, 2018, Constraining coupled hydrological-hydraulic flood model by past storm events and post-event measurements in data-sparse regions,
Journal of hydrology (Amst.) 565 (2018): 160–176. doi_10.1016/j.jhydrol.2018.08.008,
DOI: 10.1016%2Fj.jhydrol.2018.08.008
Abstract
Flood modelling in data-sparse regions have been always limited to empirical, statistical or geomorphic approaches ...
Flood modelling in data-sparse regions have been always limited to empirical, statistical or geomorphic approaches that are suitable to produce regional hazard maps. Such coarse resolution maps are not adapted for basin-scale applications, small to medium sized basins (< 1000 km(2)), especially when detailed estimates of flows and water levels of a particular event is required and hence cannot replace the hydrological/hydraulic modelling. The latter is a challenging task in data-sparse regions characterized by floods of typical duration times of a few hours which offer little opportunity for real-time recording by traditional rain-gauge networks, remote sensing or satellite imaging. Such data sparseness is not always compatible with the resolution, in both space and time, of the hydrological and hydraulic models. We propose a framework for flood modelling using sparse data from a coupled hydrological-hydraulic model constrained by past storm events and post-event measurements in space. The approach is applied to the Awali river basin (301 km(2)), in Lebanon, particularly to simulate the investigated early January 2013 extreme flood event, which is considered one of the largest events in the last three decades. The hydrological model was calibrated and evaluated with 12 past storm events aiming at defining narrow parameter ranges and uncertainty was performed with Monte Carlo simulations for these parameter ranges. The hydraulic model, based on a fine resolution DEM, was simulated using hydrological outflows and validated with 27 post-event measurements in space of high water marks. The resulting outflow values were satisfactory, and uncertainty was reduced when compared with arbitrarily wide parameter ranges. The hydrological model performance was highly variable but for the hydraulic model, 93% of the observed water levels fall within the simulated uncertainty bounds with an RMSE error of 0.26 m. The proposed framework allows mapping the possible inundation and can be compared to other approaches dealing with model complexity and associated performances.
Brocca, Luca; Tarpanelli, Angelica; Filippucci, Paolo; Dorigo, Wouter; Zaussinger, Felix; Gruber, Alexander; Fernandez-Prieto, Diego, 2018, How much water is used for irrigation? A new approach exploiting coarse resolution satellite soil moisture products,
International journal of applied earth observation and geoinformation 73 (2018): 752–766. doi_10.1016/j.jag.2018.08.023,
DOI: 10.1016%2Fj.jag.2018.08.023
Abstract
Knowledge of irrigation is essential for ensuring food and water security, and to cope with ...
Knowledge of irrigation is essential for ensuring food and water security, and to cope with the scarcity of water resources, which is expected to exacerbate under the pressure of climate change and population increase. Even though irrigation is likely the most important direct human intervention in the hydrological cycle, we have only partial knowledge on the areas of our planet in which irrigation takes place, and almost no information on the amount of water that is applied for irrigation.
Depellegrin D.; Menegon S.; Farella G.; Ghezzo M.; Gissi E.; Sarretta A.; Venier C.; Barbanti A., 2017, Multi-objective spatial tools to inform maritime spatial planning in the Adriatic Sea,
Science of the total environment 609 (2017): 1627–1639. doi_10.1016/j.scitotenv.2017.07.264,
DOI: 10.1016%2Fj.scitotenv.2017.07.264
Abstract
This research presents a set of multi-objective spatial tools for sea planning and environmental management ...
This research presents a set of multi-objective spatial tools for sea planning and environmental management in the Adriatic Sea Basin. The tools address four objectives_ 1) assessment of cumulative impacts from anthropogenic sea uses on environmental components of marine areas; 2) analysis of sea use conflicts; 3) 3-D hydrodynamic modelling of nutrient dispersion (nitrogen and phosphorus) from riverine sources in the Adriatic Sea Basin and 4) marine ecosystem services capacity assessment from seabed habitats based on an ES matrix approach. Geospatial modelling results were illustrated, analysed and compared on country level and for three biogeographic subdivisions, Northern-Central-Southern Adriatic Sea. The paper discusses model results for their spatial implications, relevance for sea planning, limitations and concludes with an outlook towards the need for more integrated, multi-functional tools development for sea planning.
Elia G.; Cotecchia F.; Pedone G.; Vaunat J.; Vardon P.J.; Pereira C.; Springman S.M.; Rouainia M.; Van Esch J.; Koda E.; Josifovski J.; Nocilla A.; Askarinejad A.; Stirling R.; Helm P.; Lollino P.; Osinski P., 2017, Numerical modelling of slope-vegetation-atmosphere interaction_ An overview,
Quarterly journal of engineering geology and hydrogeology 50 (2017): 249–270. doi_10.1144/qjegh2016-079,
DOI: 10.1144%2Fqjegh2016-079
Abstract
The behaviour of natural and artificial slopes is controlled by their thermo-hydro-mechanical conditions and by ...
The behaviour of natural and artificial slopes is controlled by their thermo-hydro-mechanical conditions and by soil-vegetation-atmosphere interaction. Porewater pressure changes within a slope related to variable meteorological settings have been shown to be able to induce soil erosion, shrinkage-swelling and cracking, thus leading to an overall decrease of the available soil strength with depth and, ultimately, to a progressive slope collapse. In terms of numerical modelling, the stability analysis of partially saturated slopes is a complex problem and a wide range of approaches from simple limit equilibrium solutions to advanced numerical analyses have been proposed in the literature. The more advanced approaches, although more rigorous, require input data such as the soil water retention curve and the hydraulic conductivity function, which are difficult to obtain in some cases. The quantification of the effects of future climate scenarios represents an additional challenge in forecasting slope-atmosphere interaction processes. This paper presents a review of real and ideal case histories regarding the numerical analysis of natural and artificial slopes subjected to different types of climatic perturbations. The limits and benefits of the different numerical approaches adopted are discussed and some general modelling recommendations are addressed.
Donnini M., Napolitano E., Salvati P., Ardizzone F., Bucci F., Fiorucci F., Santangelo M., Cardinali M., Guzzetti F., 2017, Impact of event landslides on road networks_ a statistical analysis of two Italian case studies,
Landslides (Berl., Internet) (2017). doi_10.1007/s10346-017-0829-4,
DOI: 10.1007%2Fs10346-017-0829-4
Abstract
Despite abundant information on landslides, and on landslide hazard and risk, in Italy little is ...
Despite abundant information on landslides, and on landslide hazard and risk, in Italy little is known on the direct impact of event landslides on road networks, and on the related economic costs. We investigated the physical and economic damage caused by two rainfall-induced landslide events in Central and Southern Italy, to obtain road restoration cost statistics. Using a GIS-based method, we exploited road maps and landslide event inventory maps to compute different metrics that quantify the impact of the landslide events on the natural landscape, and on the road networks, by road type. The maps were used with cost data obtained from multiple sources, including local authorities, and specific legislation, to evaluate statistically the unit cost per metre of damaged road, and the unit cost per square metre of damaging landslide, separately for main and secondary roads. The obtained unit costs showed large variations which we attribute to the different road types in the two study areas and to the different abundance of landslides. Our work confirms the long-standing conundrum of obtaining accurate landslide damage data, and outlines the need for reliable, standardized methods to evaluate landslide damage and associated restoration costs that regional and local administrations can use rapidly in the aftermath of a landslide event. We conclude recommending that common standardized procedures to collect landslide cost data following each landslide event are established, in Italy and elsewhere. This will allow for more accurate and reliable evaluations of the economic costs of landslide events.
Baroni C. [1], Bondesan A.[2], Chiarle M.[3], 2017, Report of the glaciological survey 2016|Relazioni della campagna glaciologica 2016,
Geografia fisica e dinamica quaternaria (Testo stamp.) 40 (2017): 233–319. doi_10.4461/GFDQ2017.40.14,
DOI: 10.4461%2FGFDQ2017.40.14
Abstract
In the reports the following rules and conventions were
observed. The numbers in bold type ...
In the reports the following rules and conventions were
observed. The numbers in bold type preceding the name of
the glaciers are those of the «Catasto dei Ghiacciai Italiani»
(Inventory of Italian Glaciers), 4 voll., Comitato Glaciologico
Italiano, 1959-1962, and subsequent variations. The numbers
in bold type that countermark photographs and figures correspond to those of the glacier inventory. In addition to the
subject, the photographic station, the format of the negative,
the focal length of the lens, the date and the author are also
indicated. The letters, sometime in pairs, between brackets
and small, placed next to the symbols of the signals, have the
following meaning_ c, centre; d, right; s, left; f, frantal; l, lateral. The symbols (C), (T) and (A) indicate that the altitude
they refer to, always expressed in metres, has been derived
from the topographical map, determined topographically or
obtained with an altimeter, respectively.
In the tables summarising the variations of each glacier the
distances, expressed in metres, are approximated to ± 0.5 m
and are intended as real distances. Unless otherwise indicated
in brackets, previous distance means that of the year 2016.
Variations are indicated with the following symbols_ - retreat;
+ advance; - X not quanti/iable retreat; + X not quantifiable
advance, O stationary glacier; ? uncertain variation; SN snout
covered by residual snow; NM not measured
Pisano, L.; Zumpano, V.; Malek, Z; Rosskopf, C. M.; Parise, M.;, 2017, Variations in the susceptibility to landslides, as a consequence of land cover changes_ A look to the past, and another towards the future,
Science of the total environment 601-602 (2017): 1147–1159. doi_10.1016/j.scitotenv.2017.05.231,
DOI: 10.1016%2Fj.scitotenv.2017.05.231
Abstract
Land cover is one of the most important conditioning factors in landslide susceptibility analysis. Usually ...
Land cover is one of the most important conditioning factors in landslide susceptibility analysis. Usually it is considered as a static factor, but it has proven to be dynamic, with changes occurring even in few decades. In this work the influence of land cover changes on landslide susceptibility are analyzed for the past and for future scenarios. For the application, an area representative of the hilly-low mountain sectors of the Italian Southern Apennines was chosen (Rivo basin, in Molise Region). With this purpose landslide inventories and land cover maps were produced for the years 1954, 1981 and 2007. Two alternative future scenarios were created for 2050, one which follows the past trend (2050-trend), and another one more extreme, foreseeing a decrease of forested and cultivated areas (2050-alternative). The landslide susceptibility analysis was performed using the Spatial Multi-Criteria Evaluation method for different time steps, investigating changes to susceptibility over time. The results show that environmental dynamics, such as land cover change, affect slope stability in time. In fact there is a decrease of susceptibility in the past and in the future 2050-trend scenario. This is due to the increase of forest or cultivated areas, that is probably determined by a better land management, water and soil control respect to other land cover types such as shrubland, pasture or bareland. Conversely the results revealed by the alternative scenario (2050-alternative), show how the decrease in forest and cultivated areas leads to an increase in landslide susceptibility. This can be related to the assumed worst climatic condition leading to a minor agricultural activity and lower extension of forested areas, possibly associated also to the effects of forest fires. The results suggest that conscious landscape management might contribute to determine a significant reduction in landslide susceptibility.
Paola Reichenbach, Michele Santangelo, 2017, SISMA 2016 – Relazione di sopralluogo nel comune di Visso – SAE,
24 marzo 2017, pp.1–18, 2017,
Abstract
Provincia: Macerata
Comune_ Visso
Area SAE
1. Borgo San Giovanni, Campo sportivo
2. Villa S. Antonio, Piè di Poggio
3. ...
Provincia: Macerata
Comune_ Visso
Area SAE
1. Borgo San Giovanni, Campo sportivo
2. Villa S. Antonio, Piè di Poggio
3. Villa S. Antonio, Pretara
Fausto Guzzetti, Michele Santangelo, 2017, SISMA 2016 – Relazione di sopralluogo per la valutazione dei dissesti nei Comuni di Campotosto (AQ) e Crognaleto (TE),
12 marzo 2017, pp.1–34, 2017,
Abstract
Provincia: L'Aquila
Comune_ Campotosto
Indirizzo/Località: Ortolano
Coordinate geografiche (WGS 84 lon/lat in formato sessagesimale): 42°31'11.6"N 13°25'31.5"E ...
Provincia: L'Aquila
Comune_ Campotosto
Indirizzo/Località: Ortolano
Coordinate geografiche (WGS 84 lon/lat in formato sessagesimale): 42°31'11.6"N 13°25'31.5"E
Mauro Rossi, Michele Santangelo, 2017, SISMA 2016 – Relazione di sopralluogo nel comune di Valfornace, ex Pievebovigliana,
23 febbraio 2017, pp.1–11, 2017,
Abstract
Provincia: Macerata
Comune_ Comune di Valfornace, ex Pievebovigliana (MC)
Indirizzo/Località, Coordinate geografiche (WGS 84 lon/lat in ...
Provincia: Macerata
Comune_ Comune di Valfornace, ex Pievebovigliana (MC)
Indirizzo/Località, Coordinate geografiche (WGS 84 lon/lat in formato sessagesimale):
La tabella seguente mostra le coordinate dei siti per il posizionamento delle aree da destinare all'ubicazione di Soluzioni Abitative in Emergenza (SAE) in località Pievebovigliana (Comune di Valfornace, ex Pievebovigliana) proposte dal CNR IRPI sulla base di una analisi di fotointerpretazione (Aree SAE n. 1, 2, 3), dal Comune di Valfornace, ex Pievebovigliana (Area SAE n. 4) e dalla Regione Marche (Area SAE n. 5).
Mauro Rossi, Michele Santangelo, 2017, SISMA 2016 – Relazione di sopralluogo effettuato nel comune di Bolognola – MAPRE,
23 febbraio 2017, pp.1–10, 2017,
Abstract
Provincia: Macerata
Comune_ Bolognola
Indirizzo/Località,
Versante a SO dell'incrocio tra la Strada Provinciale 47 e Via Angelo Primavera, ...
Provincia: Macerata
Comune_ Bolognola
Indirizzo/Località,
Versante a SO dell'incrocio tra la Strada Provinciale 47 e Via Angelo Primavera, località Bolognola
Coordinate geografiche (WGS formato sessagesimale): lon 13°13'01''E lat N 42°59'51''N
Mauro Rossi, Michele Santangelo, 2017, SISMA 2016 – Relazione di sopralluogo nel comune di Bolognola, SAE,
23 febbraio 2017, pp.1–9, 2017,
Abstract
Provincia: Macerata
Comune_ Bolognola
Indirizzo/Località, Coordinate geografiche (WGS 84 lon/lat in formato sessagesimale):; Lon_
13°13'45"E; Lat_ 42°59'37"N ...
Provincia: Macerata
Comune_ Bolognola
Indirizzo/Località, Coordinate geografiche (WGS 84 lon/lat in formato sessagesimale):; Lon_
13°13'45"E; Lat_ 42°59'37"N
F. Gabrieli, P.R. Tecca, A.M. Deganutti, A. Pasuto, L. Schenato, 2017, D3.2 – Numerical model for debris-flow seismic activity,
D3.2, 2017,
Abstract
Questo rapporto descrive la modellazione numerica delle colate detritiche sviluppata nell'ambito del progetto DOMINO - ...
Questo rapporto descrive la modellazione numerica delle colate detritiche sviluppata nell'ambito del progetto DOMINO - WaterWorks2014 Cofunded Call
Luca Palmieri, Luca Schenato, Miguel Gonzales-Herraez, Juan P. Aguilar-López, Thom Bogaard, 2017, Deliverable D1.2 – Specification of the DPS system,
D1.2, 2017,
Abstract
Questo documento definisce le specifiche del sistema DPS (Distributed Pressure Sensor) da sviluppare nell'ambito del ...
Questo documento definisce le specifiche del sistema DPS (Distributed Pressure Sensor) da sviluppare nell'ambito del progetto DOMINO - WaterWorks2014 Cofunded Call
Ivan Marchesini, Paola Salvati, Mauro Rossi, Marco Donnini, Fausto Guzzetti, Simone Sterlacchini, Marco Zazzeri, Giacomo Cappellini, Debora Voltolina, 2017, FONDAZIONE GENERALI – Mappatura nazionale delle aree inondabili in funzione di diversi tempi di ritorno,
Report 5 - 2017, 2017,
Abstract
Il lavoro ha avuto come obiettivo la definizione di una metodologia finalizzata alla delineazione delle ...
Il lavoro ha avuto come obiettivo la definizione di una metodologia finalizzata alla delineazione delle aree
inondabili in funzione di diversi tempi di ritorno applicabile a tutto il territorio nazionale. Le aree inondabili
sono generalmente definite utilizzando modelli di flusso mono e bi-dimensionali, l'applicazione di questi
modelli è condizionata dalla disponibilità di dati accurati e sono generalmente molto costosi in termini di
disponibilità dei dati, tempo di calcolo e risorse umane impiegate. Per questo motivo la loro applicazione è
limitata a studi specifici di singoli tratti delle aste fluviali. Per ovviare a queste limitazioni alcuni autori
((Degiorgis et al., 2012); (De Risi, Jalayer, & De Paola, 2015); (Manfreda et al., 2015)) hanno sperimentato
l'utilizzo dei metodi statistici finalizzati all'individuazione delle aree inondabili, applicandoli con risultati
soddisfacenti a bacini idrografici di dimensioni limitate utilizzati come aree test.
In ragione dell'estensione dell'area di studio, corrispondente all'intero territorio nazionale, e della
numerosità dei corsi d'acqua da valutare, si è scelto di far uso di un approccio statistico simile a quelli
proposti in letteratura e precedentemente elencati. Sulla base di tali lavori, nel corso del biennio di
progetto, IRPI ha sviluppato una procedura statistica che utilizza modelli statistici di tipo «machine-
learning» per classificare il territorio (i.e. inondabile vs non-inondabile) basandosi sull'uso di variabili
morfometriche derivate dai modelli digitali di elevazione (DEM). In pratica, l'approccio proposto per la
determinazioni delle aree inondabili si basa su criteri di tipo geomorfologico. La modellazione ha previsto
due fasi distinte_ (i) fase di calibrazione del modello; (ii) fase di validazione del modello. Per la calibrazione
sono stati utilizzati i dati relativi alle aree inondabili resi disponibili nei PAI ed elaborati ai sensi del D.Lgs
49/2010 di recepimento della Direttiva Flood. La procedura statistica elaborata nell'ambito del progetto e
l'applicazione su scala nazionale ha consentito l'individuazione delle aree inondabili delle aste fluviali e dei
bacini secondari che non sono stati oggetto delle perimetrazioni della pericolosità idraulica elaborate ai
sensi del D.Lgs 49/2010 che costituiscono lo scenario di pericolosità istituzionale di riferimento. Il risultato
finale è uno scenario di pericolosità modellato, ovvero una zonazione sinottica della propensione del
territorio ad essere inondato (suscettibilità da inondazione), per vari tempi di ritorno, uniforme e
confrontabile per tutto il territorio nazionale basato su criteri di tipo geomorfologico
Questo primo tentativo di modellazione statistica a scala nazionale finalizzata alla perimetrazione della
pericolosità idraulica è da considerarsi un notevole valore aggiunto alla conoscenza della pericolosità
idraulica del territorio italiano, complementare, e non sostituibile, agli scenari istituzionali dei PAI e delle
perimetrazioni ai sensi D.Lgs 49/2010.
Dott.ssa Maria Elena Martinotti
Dott. Mauro Rossi
Dott. Ivan Marchesini
Dott.ssa Maria Teresa Brunetti
Dott.ssa Silvia Peruccacci, 2017, CC-DPC – VALIDAZIONE E PRESTAZIONI DEL SANF,
30 aprile 2017 VALIDAZIONE E PRESTAZIONI DEL SANF, 2017,
Abstract
Il presente documento contiene la definizione delle procedure per la validazione del
sistema SANF, sia per ...
Il presente documento contiene la definizione delle procedure per la validazione del
sistema SANF, sia per quanto riguarda la stima delle effettive capacità previsionali, sia
per quanto riguarda la valutazione dell'efficienza operativa e della resilienza del
complesso hardware e software di SANF. Sono analizzate le performance del sistema,
sia per quanto concerne il grado di successo con cui SANF è stato in grado di predire
eventi franosi su scala nazionale, che per quanto riguarda il regime di regolare
efficienza del sistema. Tali analisi rientrano nelle attività di ricerca previste dall'Accordo
di Collaborazione (AC) tra il Dipartimento della Protezione Civile (DPC) e il Centro di
Competenza dell'Istituto di Ricerca per la Protezione Idrogeologica (CC IRPI), del
Consiglio Nazionale delle Ricerche (CNR) [DA-009]. Le metodologie analitiche e le
procedure descritte in tale documento sono inoltre funzionali alla certificazione del
sistema SANF come descritto più in dettaglio nel rapporto [DR-006].
Cinzia Bianchi
Francesco Bucci
Mauro Cardinali
Marco Cavalli
Stefano Crema
Fausto Guzzetti
Ivan Marchesini
Lorenzo Marchi
Mauro Rossi
Paola Salvati
Michele Santangelo, 2017, SISMA 2016 – Relazione sulla suscettibilità geo-idrologica e l’esposizione ai pericoli geo-idrologici nel territorio di Pescara del Tronto, Comune di Arquata del Tronto (AP),
19 maggio 2017 Pescara del Tronto, 2017,
Abstract
Su richiesta della Funzione Tecnica della Direzione di Comando e Controllo di Rieti, si è
provveduto ...
Su richiesta della Funzione Tecnica della Direzione di Comando e Controllo di Rieti, si è
provveduto a valutare le condizioni di suscettibilità geo-idrologica e di esposizione a pericoli
geo-idrologici di aree nel territorio limitrofo a Pescara del Tronto (AP).
Nell'area oggetto di studio sono presenti diverse tipologie di fenomeni geo-idrologici
potenzialmente pericolosi, fra i quali frane di scivolamento superficiali e profonde, crolli e cadute
massi, colate di detrito, piene e piene improvvise, e valanghe. La presente relazione considera
esclusivamente le tre tipologie di fenomeni ritenute di maggiore interesse, ed in particolare_ (i) le
frane di scivolamento, (ii) i crolli e le cadute massi, e (iii) le colate di detrito. La relazione non
considera le piene e le piene improvvise, le valanghe, e le amplificazioni sismiche locali.
Per definire in modo per quanto possibile oggettivo e riproducibile le condizioni di suscettibilità e
il conseguente livello di esposizione ai pericoli geo-idrologici considerati cui sono soggette le aree
di studio, si è provveduto a definire una specifica procedura d'analisi. La procedura utilizza dati
disponibili od acquisiti ad hoc per la zonazione, e restituisce una valutazione semi-quantitativa del
grado di esposizione ai pericoli geo-idrologici a cui sono soggette le aree oggetto d'indagine, o
parti di esse.
L'applicazione della procedura ha richiesto l'utilizzo di dati territoriali e di modelli di simulazione
dei fenomeni geo-idrologici. I dati territoriali comprendono modelli digitali del terreno con
risoluzione al suolo di 10 m ? 10 m e 3 m ? 3 m, due voli di fotografie aeree stereoscopiche riprese
rispettivamente nel 1955 a scala 1_55.000 e nel 1977 a scala 1_13.000, una carta inventario dei
fenomeni franosi realizzata ad hoc, la carta geologica della Regione Marche, a scala 1_10.000, le
cartografie del Piano di Assetto Idrogeologico disponibili per l'area di studio, oltre che la Carta
Tecnica Regionale. I modelli utilizzati per la definizione dei livelli di suscettibilità sono stati il
modello STONE, per la simulazione del processo di caduta massi, i modelli concettuali "Modified
Single Flow Direction" e "r.randomwalk" per la simulazione dei fenomeni di colata di detrito, e un
modello euristico per la definizione di possibili scenari evolutivi di frane di scivolamento,
superficiali e profonde, già sperimentato in Umbria.
La procedura è stata applica sia ad aree già edificate, sia ad aree non ancora edificate nel territorio
limitrofo a Pescara del Tronto. I risultati dell'applicazione della procedura sono descritti in
dettaglio per il centro abitato di Pescara del Tronto e per l'intero territorio oggetto di studio. Nel
primo caso, l'analisi ha definito le condizioni di esposizione ai pericoli considerati delle aree già
edificate, ancorché danneggiate più o meno severamente dai sismi. Nel secondo caso, l'analisi ha
permesso di individuare aree non edificate ma potenzialmente urbanizzabili, sulla base di criteri
predefiniti.
Cinzia Bianchi
Francesco Bucci
Mauro Cardinali
Marco Cavalli
Stefano Crema
Fausto Guzzetti
Ivan Marchesini
Lorenzo Marchi
Mauro Rossi
Paola Salvati
Michele Santangelo, 2017, SISMA 2016 – Relazione sulla suscettibilità geo-idrologica e l’esposizione ai pericoli geo-idrologici nel territorio del Comune di Castelsantangelo sul Nera (MC),
19 maggio 2017 versione 1.5 CSsN, 2017,
Abstract
Su richiesta della Funzione Tecnica della Direzione di Comando e Controllo di Rieti, si è
provveduto ...
Su richiesta della Funzione Tecnica della Direzione di Comando e Controllo di Rieti, si è
provveduto a valutare le condizioni di suscettibilità geo-idrologica e di esposizione a pericoli
geo-idrologici di aree nel territorio del Comune di Castelsantangelo sul Nera (MC).
Nell'area oggetto di studio sono presenti diverse tipologie di fenomeni geo-idrologici
potenzialmente pericolosi, fra i quali frane di scivolamento superficiali e profonde, crolli e cadute
massi, colate di detrito, piene e piene improvvise, e valanghe. La presente relazione considera
esclusivamente le tre tipologie di fenomeni ritenute di maggiore interesse, ed in particolare_ (i) le
frane di scivolamento, (ii) i crolli e le cadute massi, e (iii) le colate di detrito. La relazione non
considera le piene e le piene improvvise, le valanghe, e le amplificazioni sismiche locali.
Per definire in modo per quanto possibile oggettivo e riproducibile le condizioni di suscettibilità e
il conseguente livello di esposizione ai pericoli geo-idrologici considerati cui sono soggette le aree
di studio, si è provveduto a definire una specifica procedura d'analisi. La procedura utilizza dati
disponibili od acquisiti ad hoc per la zonazione, e restituisce una valutazione semi-quantitativa del
grado di esposizione ai pericoli geo-idrologici a cui sono soggette le aree oggetto d'indagine, o
parti di esse.
L'applicazione della procedura ha richiesto l'utilizzo di dati territoriali e di modelli di simulazione
dei fenomeni geo-idrologici. I dati territoriali comprendono un modello digitale del terreno con una
risoluzione al suolo di 10 m ? 10 m, due voli di fotografie aeree stereoscopiche riprese
rispettivamente nel 1955 a scala 1_55.000 e nel 1997 a scala 1_20.000, una carta inventario dei
fenomeni franosi realizzata ad hoc, la carta geologica della Regione Marche, a scala 1_10.000, le
cartografie del Piano di Assetto Idrogeologico disponibili per l'area di studio, oltre che la Carta
Tecniche Regionale. I modelli utilizzati per la definizione dei livelli di suscettibilità sono stati il
modello STONE, per la simulazione del processo di caduta massi, i modelli concettuali "Modified
Single Flow Direction" e "r.randomwalk" per la simulazione dei fenomeni di colata di detrito, e un
modello euristico per la definizione di possibili scenari evolutivi di frane di scivolamento,
superficiali e profonde, già sperimentato in Umbria.
La procedura è stata applicata sia ad aree già edificate, sia ad aree non ancora edificate nel territorio
del Comune di Castelsantangelo sul Nera. I risultati dell'applicazione della procedura sono
descritti in dettaglio per sei centri abitati esistenti, fra i quali il capoluogo di Castelsantangelo sul
Nera e le frazioni di Gualdo, Nocelleto, Nocria, Macchie e Vallinfante, e per l'intero territorio
oggetto di studio. Nel primo caso, l'analisi ha definito le condizioni di esposizione ai pericoli
considerati delle aree già edificate, ancorché danneggiate più o meno severamente dai sismi. Nel
secondo caso, l'analisi ha permesso di individuare aree non edificate potenzialmente urbanizzabili,
sulla base di criteri predefiniti.
Ivan Marchesini e Massimo Melillo, 2017, SISMA 2016 – Relazione di sopralluogo per la verifica di un’area da destinare a soluzioni abitative in emergenza (SAE) nella frazione di Pascellata – Comune di Valle Castellana,
17 ottobre 2017 Valle Castellana, 2017,
Abstract
Localizzazione
Provincia_ Teramo
Comune_ Valle Castellana
Indirizzo/Località: Pascellata
Coordinate geografiche (WGS 84 UTM): 42.700956, 13.495814 ...
Localizzazione
Provincia_ Teramo
Comune_ Valle Castellana
Indirizzo/Località: Pascellata
Coordinate geografiche (WGS 84 UTM): 42.700956, 13.495814
Ivan Marchesini, Marco Donnini, Francesco Bucci, 2017, SISMA 2016 – Relazione di sopralluogo per soluzioni abitative in emergenza (SAE), Via Salvo d’Acquisto (Campo di Mare) Comune di Cascia,
28 Luglio 2017 Via Salvo d'Acquisto (Campo di Mare), Cascia, 2017,
Abstract
Localizzazione
Provincia_ Perugia
Comune_ Cascia
Indirizzo/Località: Via Salvo d'Acquisto
Coordinate geografiche (WGS 84 lon/lat in formato ...
Localizzazione
Provincia_ Perugia
Comune_ Cascia
Indirizzo/Località: Via Salvo d'Acquisto
Coordinate geografiche (WGS 84 lon/lat in formato sessagesimale): 42.716709, 13.021540
Ivan Marchesini, Marco Donnini, Francesco Bucci, 2017, SISMA 2016 – Relazione di sopralluogo per soluzioni abitative in emergenza (SAE), Colforcella – Comune di Cascia,
28 giugno 2017 Colforcella Cascia, 2017,
Abstract
Localizzazione
Provincia_ Perugia
Comune_ Cascia
Indirizzo/Località: Colforcella
Coordinate geografiche (WGS 84 lon/lat in formato sessadecimale): ...
Localizzazione
Provincia_ Perugia
Comune_ Cascia
Indirizzo/Località: Colforcella
Coordinate geografiche (WGS 84 lon/lat in formato sessadecimale): 42.736961, 13.026558
Ivan Marchesini, Marco Donnini, Francesco Bucci, 2017, SISMA 2016 – Relazione di sopralluogo per soluzioni abitative in emergenza (SAE), Paccione – Comune di Cascia,
28 Luglio 2017 Paccione Cascia, 2017,
Abstract
Localizzazione
Provincia_ Perugia
Comune_ Cascia
Indirizzo/Località: Fosso Paccione
Coordinate geografiche (WGS 84 lon/lat in formato sessagesimale): ...
Localizzazione
Provincia_ Perugia
Comune_ Cascia
Indirizzo/Località: Fosso Paccione
Coordinate geografiche (WGS 84 lon/lat in formato sessagesimale): 42.714308, 13.020213
Ivan Marchesini, Michele Santangelo, 2017, SISMA 2016 – Relazione di sopralluogo nella Frazione di Valcaldara – Comune di NORCIA,
5 giugno 2017 Valcaldara Norcia, 2017,
Abstract
Provincia: Perugia
Comune_ Norcia
Indirizzo/Località, Coordinate geografiche (WGS 84 lon/lat in formato sessagesimale):
Area SAE
VALCALDARA
Latitudine
42°44'25.76"N
Longitudine
13° 7'32.60"E ...
Provincia: Perugia
Comune_ Norcia
Indirizzo/Località, Coordinate geografiche (WGS 84 lon/lat in formato sessagesimale):
Area SAE
VALCALDARA
Latitudine
42°44'25.76"N
Longitudine
13° 7'32.60"E